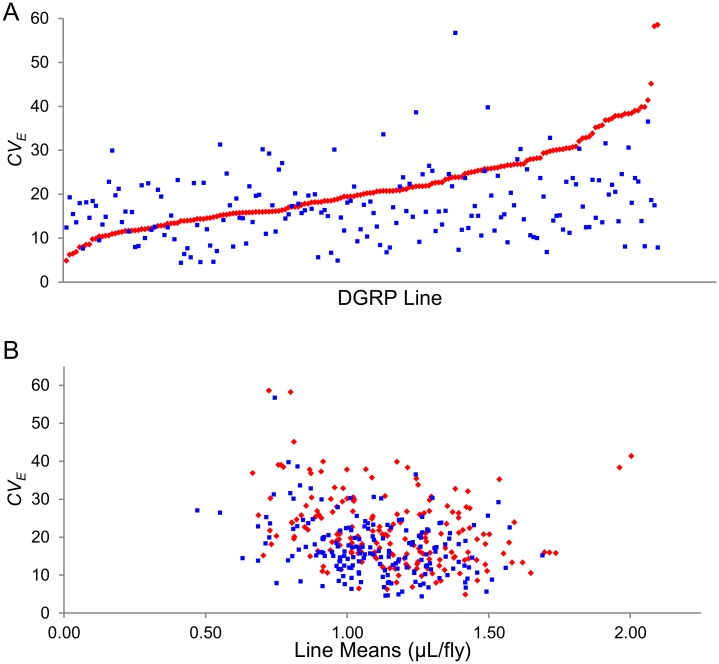
Fig 2. Variation in CV E of food intake in the DGRP.
(A) CV E of food intake, arranged in order from lowest to highest in females (red diamonds). CV E of food intake of males (blue squares) are given in the same order as the females. (B) Association of mean and CV E for food intake for females (red diamonds) and males (blue squares).

