Fig. 4.

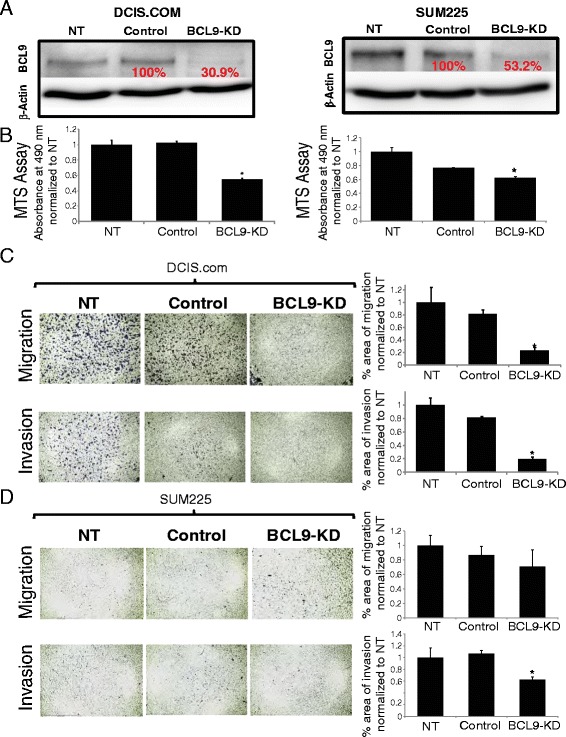
BCL9-KD decreased proliferative, migratory and invasive activity of DCIS cell lines in vitro. a Western blot analysis using anti-BCL9 antibody and anti-β-actin as a loading control (top), and (b) MTS assays of non-transduced (NT), scrambled control (control) and BCL9-KD in DCIS.COM (left panels) and SUM225 (right panels). Bar graphs represent mean absorbance at 490 nm normalized to NT ± standard error of the mean (SEM) (n = 3, * p <0.05). c, d Representative images of the migration and invasion assays. Bar graphs represent percent area of cells migrated (top) and invaded (bottom) under the membrane after 24 h for DCIS.COM and 96 h for SUM225. Invasion and migration were determined by ImageJ analysis of microscopic images per sample, the data are mean values normalized to NT ± SEM (n = 3, * p <0.05)
