Fig. 8.

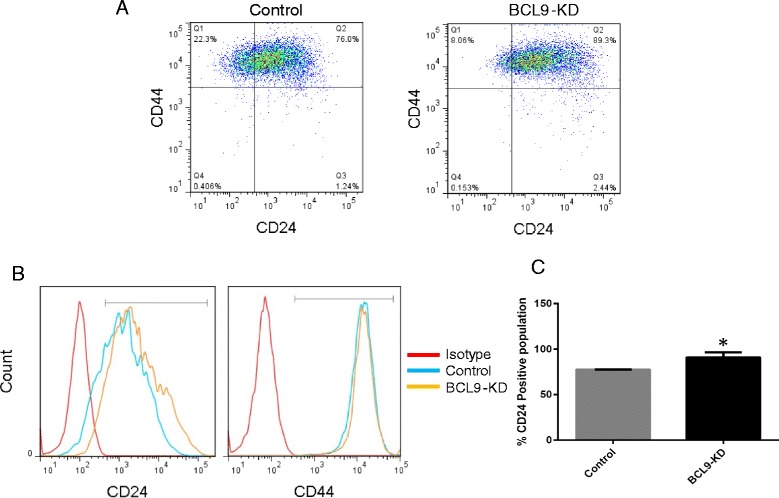
BCL9-KD increased CD24 positive population in DCIS.COM. a Representative flow analysis of control and BCL9-KD DCIS.COM cells for CD24 and CD44 (top), b representative histogram showing changes in CD24 (left) and CD44 (right) in control (blue line), BCL9-KD DCIS.COM cells (yellow line) compared to isotype control (red line). c Bar graphs show the percentage of CD24-positive population in BCL9 KD and control, the data represent the mean ± standard error of the mean
