Fig. 1.

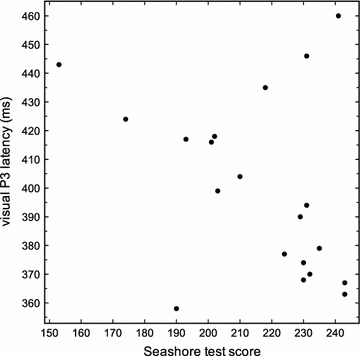
Correlation between P3 latency of the visual event-related potentials and the total score of the Seashore-test (r = −0.470 and p = 0.036; Spearman-rank-coefficient)

Correlation between P3 latency of the visual event-related potentials and the total score of the Seashore-test (r = −0.470 and p = 0.036; Spearman-rank-coefficient)