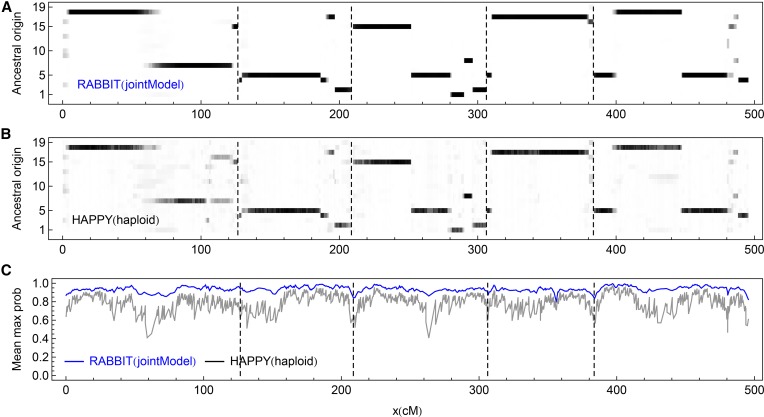
Figure 5.
The posterior probabilities of the 19 ancestral origins for the real MAGIC lines. The dashed vertical lines indicate the chromosome boundaries. (A and B) The posterior probabilities for an example line (MAGIC.100) are represented by levels of gray shading, with white = 0 and black = 1. (C) The maximum posterior probabilities at each marker, averaged over all 703 MAGIC lines.

