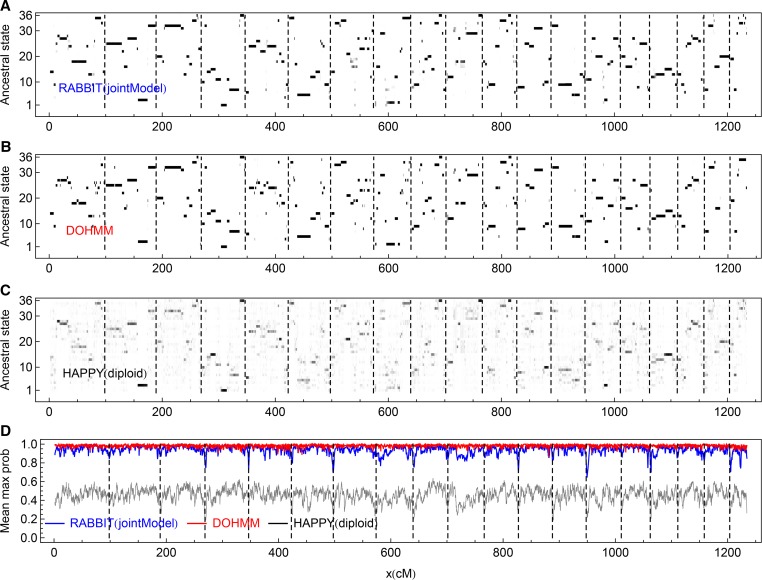
Figure 6.
The posterior probabilities of the 36 ancestral origin states for the real DO individuals. The dashed vertical lines indicate the chromosome boundaries. (A–C) The posterior probabilities for a sampled individual (F01) are represented by levels of gray shading, with white = 0 and black = 1. (D) The maximum posterior probabilities at each marker, averaged over all 94 DO individuals.

