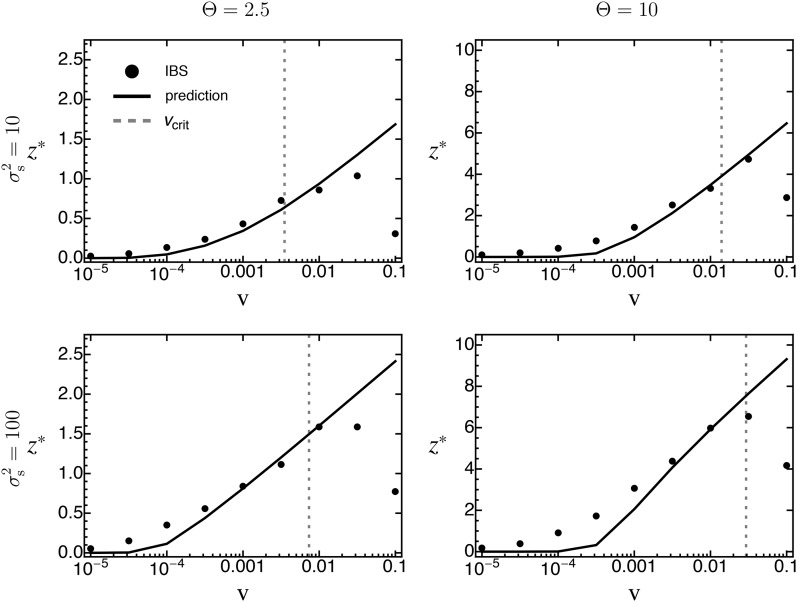
Figure 7.
The average distance traversed in phenotype space, , as a function of the rate of environmental change ν, when standing genetic variation is the sole source for adaptation. Symbols show results from individual-based simulations (averaged over 100 replicate runs). The solid line gives the analytical prediction (Equation 28), with taken from Equation 16. The shaded dashed line gives the critical rate of environmental change (Equation 29). Error bars for standard errors are contained within the symbols. Fixed parameters: ,

