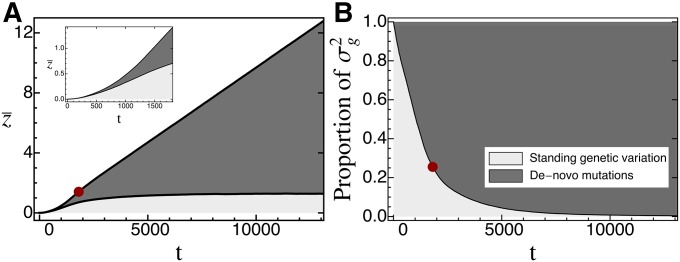
Figure 8.

The contributions of standing genetic variation (light gray) and de novo mutations (dark gray) to the cumulative phenotypic response to selection (A) and the current genetic variance (B) over time. Plots show average trajectories over 1000 replicate simulations. The red circle marks the point in time where of the total phenotypic responses were due to de novo mutations. The inset in A shows a more detailed plot of the dynamics of up to this point. Fixed parameters: , , , ,
