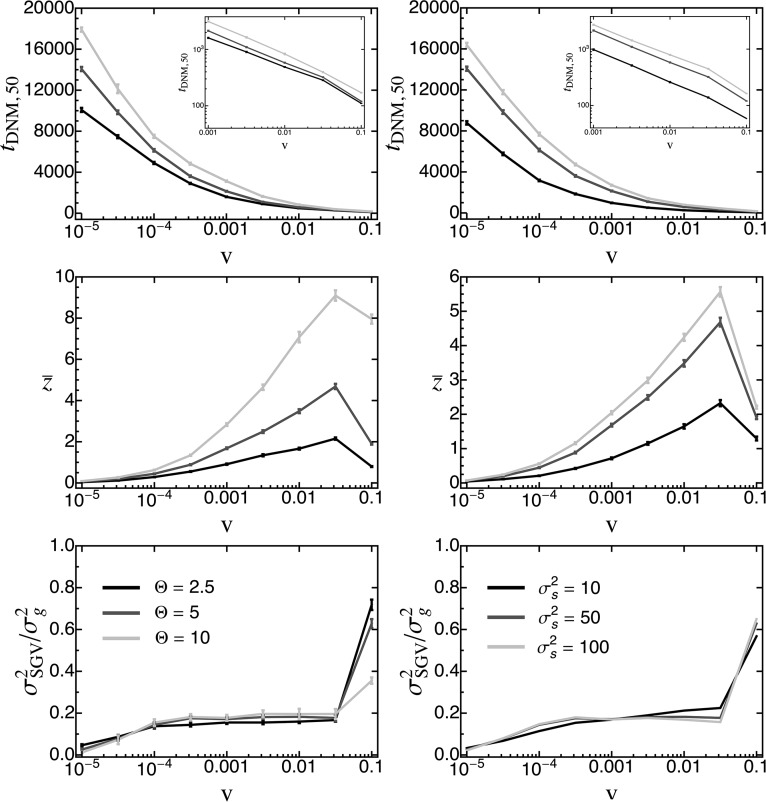
Figure 9.
(Top row) The point in time where of the phenotypic responses to moving-optimum selection have been contributed by de novo mutations as a function of the rate of environmental change for various values of Θ (left) and (right). Insets show the results for large ν on a log scale. (Middle row) The mean total phenotypic response at this time. (Bottom row) The relative contribution of original standing genetic variation to the total genetic variance at time . Data are means (and standard deviations) from 1000 replicate simulation runs. Fixed parameters (if not stated otherwise): , , ,

