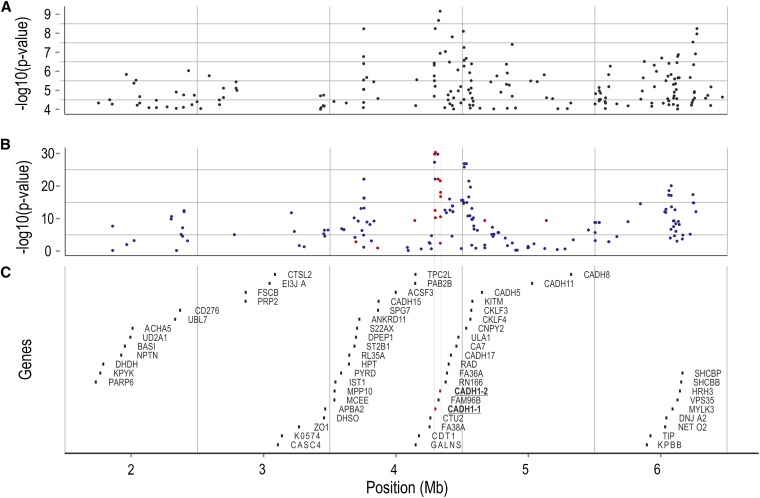
Figure 3.
Fine mapping of QTL for IPN resistance. Positions on the x-axis are relative to the ICSASG scaffold, ccf1000000016_0_0. (A) Chi-square test for independence between SNP alleles and QTL alleles, performed on Illumina reads coming from QTL-heterozygous mapping parents, aligned against ccf1000000016_0_0. (B) Chi-square test for independence between SNP alleles and QTL alleles performed on phased genotype data coming from 117 QTL-heterozygous mapping parents. Blue dots, SNPs identified in the “scan,” based on Illumina sequence data; orange dots, SNPs identified by targeted Sanger-based resequencing of the “core” QTL region. (C) Genes located within the QTL region, according to an annotation based on BLASTN + EST2GENOME, performed against a set of 34,794 Atlantic salmon cDNA/EST sequences.

