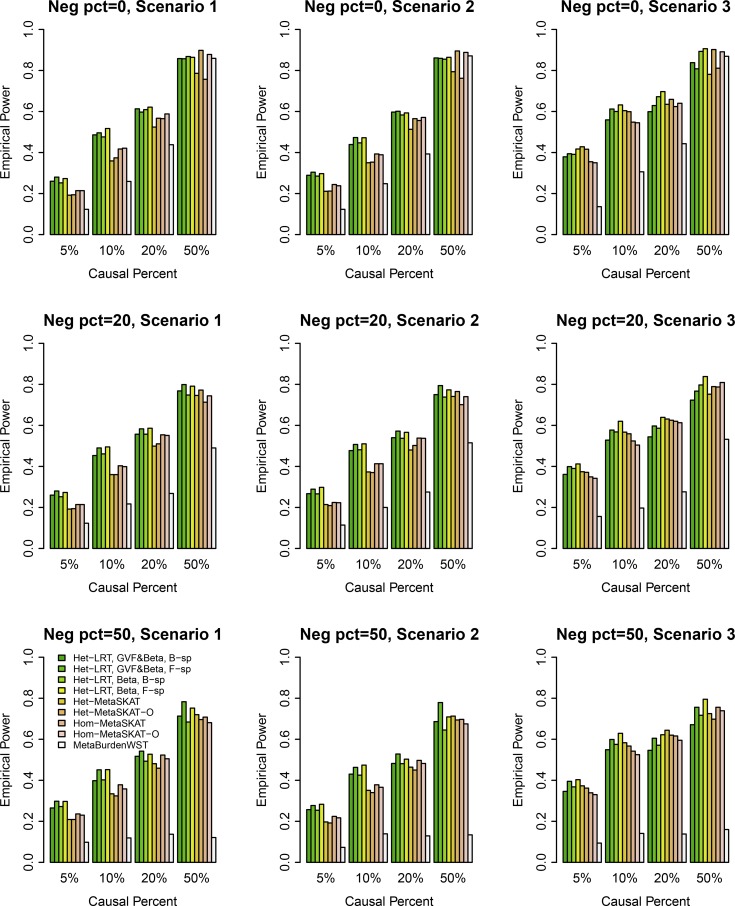
Figure 4.
The empirical power of the homogeneous LRT statistics (Hom-LRT) of models (3) and (5), MetaSKAT, and MetaBurdenWST at , when causal variants were only rare and the genetic effect is simulated as heterogeneous. When Neg pct = 0, all causal variants had positive effects; when Neg pct = 20, 20%/80% of causal variants had negative/positive effects; when Neg pct = 50, 50%/50% of causal variants had negative/positive effects.

