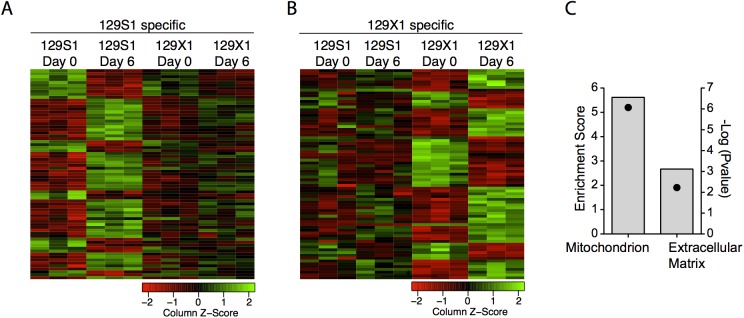
Fig 6. Identification of transcriptional signatures of calcification using microarrays.

Gene expression data was assessed before infection and at day 6 post-infection with 500pfu/g CVB3 in 129S1 and 129X1 mice using microarrays. Genotype-specific expression changes were determined. The heatmaps represent 129S1 and 129X1-specific transcriptomic signatures of infection (A, B). Functional clustering of these genes using DAVID identified significant enrichment of two clusters: mitochondrion and extracellular matrix (C). Bars represent the enrichment score and points represent the–log (Bonferonni pvalue).
