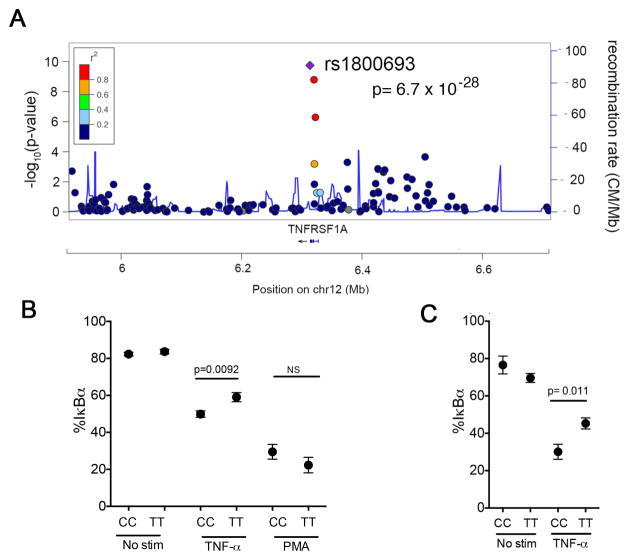
Figure 5. The TNFR1 variant rs1800693 results in increased TNFα responses.
A) Association to MS risk in the region surrounding TNFRSF1A. Y axis shows the GWAS –log(p value) for the allelic test of association as reported in (10). We have highlighted rs1800693, the most associated variant in the region. With further replication data in independent samples, rs228614 meets the GWAS significance threshold of p < 5 × 10⁻⁸. B) Degradation of IκBα after 30 minutes TNFα stimulation in CD4+CD45RA+CD45RO− T cells. (CC n=14; TT n=20). C) Degradation of IκBα after 30 minutes TNFα stimulation in CD14+ monocytes. (CC n=5; TT n=12). (p-value shown for unpaired t test).

