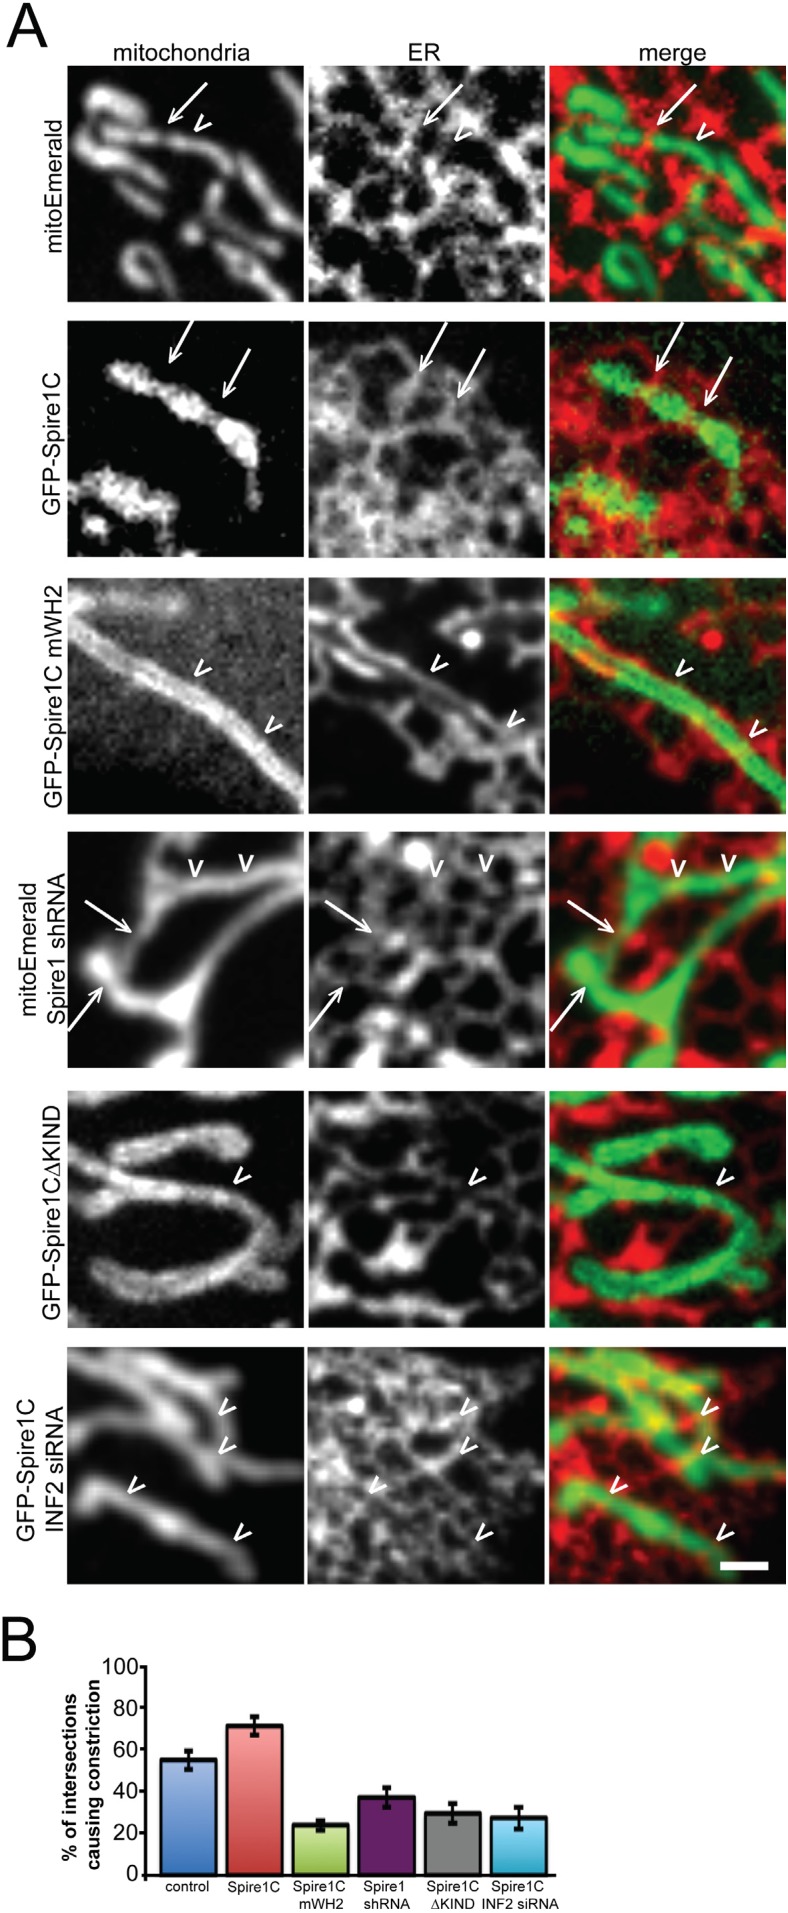
Figure 7. Spire1C overexpression enhances mitochondrial constriction via its WH2 and KIND domains in cooperation with INF2.
(A) Representative confocal images of U2OS cells expressing Ii33-mCherry in order to visualize ER tubules crossing over mitochondria in cells expressing mitoEmerald (first row) or overexpressing GFP-Spire1C (second row), GFP-Spire1C mWH2 (third row), GFP-Spire1CΔKIND (fourth row), or GFP-Spire1C while treated with INF2 siRNA (fifth row). Arrows indicate ER-mitochondria intersection points associated with mitochondrial constriction. Arrowheads indicate ER-mitochondria intersections not resulting in mitochondrial constriction. Scale bar: 1 μm. (B) Bar graphs representing the average percentage of ER-mitochondria intersections associated with mitochondrial constriction for each construct used. In cells expressing mitoEmerald, 55.2 ± 5.5% (nintersections = 172, ncells = 12) of ER-mitochondria intersections appeared to result in mitochondrial constriction. In GFP-Spire1C overexpressing cells, 71.5 ± 4.5% (nintersections = 221, ncells = 15, p < 0.05) of ER-mitochondria intersections resulted in mitochondrial constriction. In GFP-Spire1C mWH2 overexpressing cells, 24.1 ± 2.4% (nintersections = 162, ncells = 11, p < 0.01) of ER-mitochondria intersections appeared to result in mitochondrial constriction. In Spire1C knockdown cells, 37.2 ± 5.7% (nintersections = 123, ncells = 11, p < 0.001) of ER-mitochondria intersections appeared to result in mitochondrial constriction. In GFP-Spire1CΔKIND overexpressing cells, 29.5 ± 4.7% (nintersections = 95, ncells = 14, p < 0.01) of ER-mitochondria intersections appeared to result in mitochondrial constriction. In GFP-Spire1C overexpressing cells treated with INF2 siRNA, 27.5 ± 5.3% (nintersections = 178, ncells = 16, p < 0.01) of ER-mitochondria intersections appeared to result in mitochondrial constriction.

