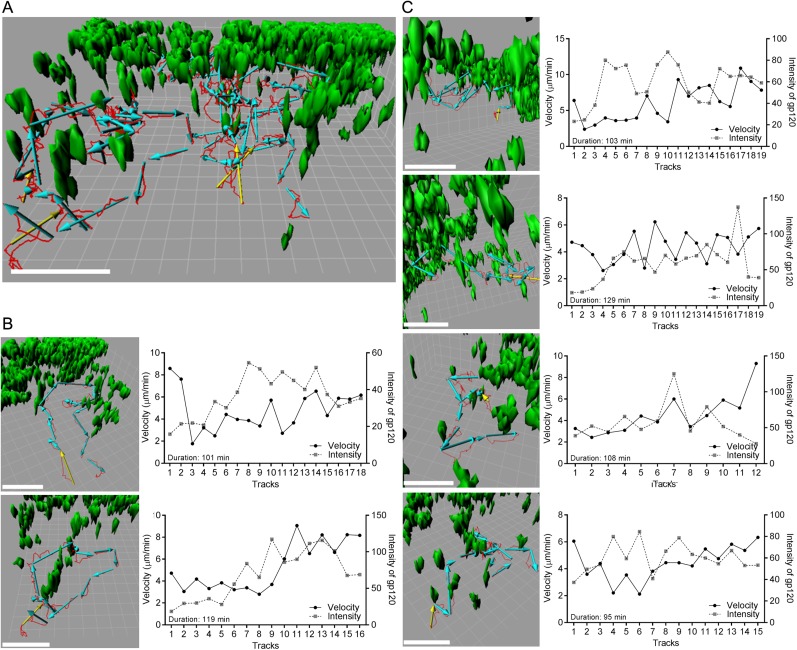
Figure 8. Individual b12 HL B cell tracks from b12 HL B cells located in the LN follicle near the IFC channel following injection of gp120.
(A) Six tracks, red lines, and displacements, yellow or cyan arrows, of b12 HL B cells were superimposed on 3-D reconstruction image of gp120 loaded IFC network cells, green. 3-D reconstruction images were generated with 50 μm z-stack volume image. Displacement arrows were generated with fragments of the original track, which disconnected at time points that showed typical turning or discontinues movement from the original single track. Yellow arrows in each track indicate the starting point. Scale bar is 50 μm. Grid spacing in 3-D view is 10 μm. (B, C) Each track in (a) was visualized from a different angle to see typical tracked cell pattern (approach, survey, move away). Scale bar is 50 μm. Grid spacing in 3-D view is 10 μm. Each individual track is shown as a single track plot of velocity (solid line) and gp120 intensity (dotted line). Duration is total time span of the original single tracks in a 2 hr intravital TPLSM imaging.

