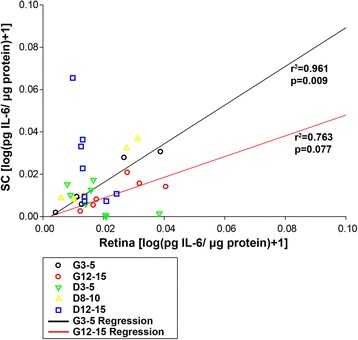
Fig. 8.

Scatterplot showing relationship between retinal and collicular IL-6. Symbols represent individual retina versus the corresponding superior colliculus. A significant, positive correlation between retinal and collicular IL-6 levels in young D2G mice (Pearson’s r 2) and a strong trend towards this same relationship was indicated in old D2G mice. Regression lines have been drawn for each of these groups to illustrate relationships. No significant relationships were shown for other groups. p values are indicated on figure
