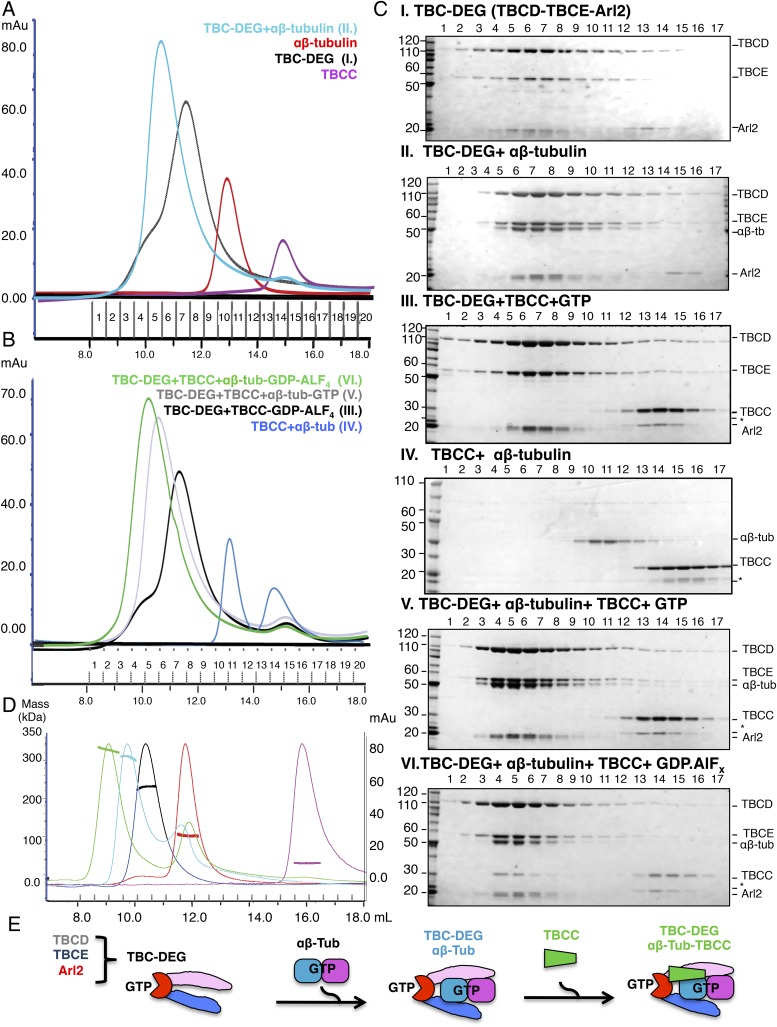
Figure 2. Hierarchical assembly of TBCC with TBC-DEG and soluble αβ-tubulin dimer binding in the GDP·Pi state.
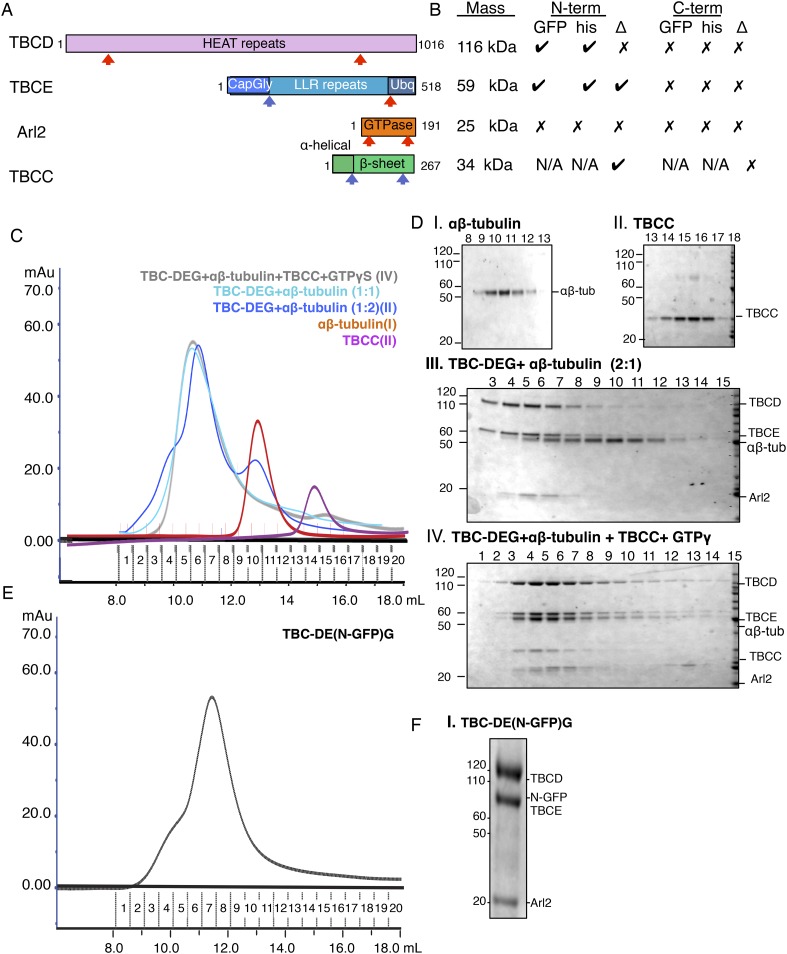
(A) Size exclusion chromatography (SEC) intensity traces of TBC-DEG (black), TBC-DEG:αβ-tubulin (cyan), αβ-tubulin (red), and TBCC (purple). (B) SEC intensity traces of TBC-DEG+TBCC+αβ-tubulin-GDP·ALFx (green), TBC-DEG+TBCC+αβ-tubulin-GTP (gray), TBC-DEG+TBCC-GTP-ALFx (black), TBCC+αβ-tubulin (blue), and αβ-tubulin+TBCC (blue). Additional states are described in Figure 2—figure supplement 1C,D. (C) Composition of SEC fractions shown in A and B using SDS-PAGE. Panel I, TBC-DEG; panel II, TBC-DEG:αβ-tubulin; panel III, TBC-DEG+TBCC-GDP·ALFx; panel IV, TBCC+αβ-tubulin; panel V, TBC-DEG+TBCC+αβ-tubulin-GTP; and panel VI, TBC-DEG+TBCC+αβ-tubulin-GDP·ALFx. TBC-DEG forms an active heterotrimeric complex, and TBCC forms a complex that co-migrates with TBC-DEG upon αβ-tubulin binding in the presence of GDP·ALFx (panel IV). The protein standard is shown on the left and proteins are marked on the right. TBC-DEG complexes interact weakly with the resin media leading to wide elution SEC profiles in most conditions. (D) Molecular masses of TBC-DEG, αβ-tubulin, TBCC, and their complexes measured using size exclusion chromatography with multi-angle light scattering (SEC-MALS). Solid lines represent SEC intensity traces on an intensity scale shown on the right y-axis, and dotted lines represent masses calculated on the mass scale shown on the left y-axis; TBC-DEG (black), αβ-tubulin (red), TBCC (purple), TBC-DEG:αβ-tubulin (cyan), and TBC-DEG:αβ-tubulin:TBCC-GDP·ALFx (green). Masses and elution volumes are detailed in Table 2. (E) Scheme for the hierarchical assembly of TBC-DEG with TBCC and αβ-tubulin and the role of nucleotide. TBCD, TBCE, and Arl2 form TBC-DEG complexes (TBC-DEG) and bind a single αβ-tubulin dimer (αβ-tub) to form TBC-DEG:αβ-tubulin (TBC-DEG:αβ-tub), which recruits TBCC in the GTP-like state to form TBC-DEG:αβ-tubulin:TBCC (TBC-DEG:αβ-tub:TBCC).


