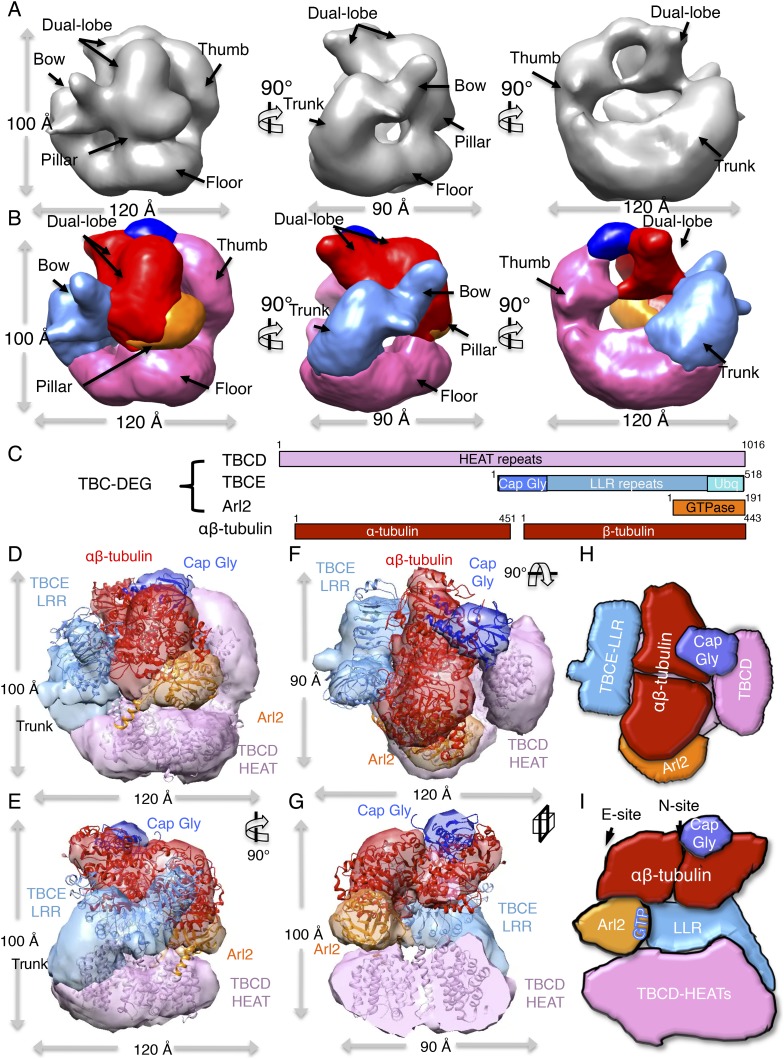
Figure 5. TBC-DEG platforms engage the αβ-tubulin dimer asymmetrically, placing it in contact with Arl2 GTPase above the hollow core.
(A) A refined TBC-DEG-Q73L:αβ-tubulin 3D map shown in three rotated views. The map shows the presence of dual regions at the top of the TBC-DEG cage density. (B) A segmented TBC-DEG-Q73L:αβ-tubulin map shown in three rotated views. A dual lobed density (red) assigned to αβ-tubulin is bound by domains at the top side of the TBC-DEG-Q73L cage. Video 3 shows the A and B views. (C) A TBC-DEG-αβ-tubulin linear domain map shown to length scale. TBCD (pink, top panel) is composed of HEAT repeats. TBCE (second panel) includes a Cap-Gly domain (dark blue), a leucine rich repeat (LRR) domain (blue), and a ubiquitin-like domain (cyan). Arl2 (third panel) consists of a G-domain or GTPase fold (orange). αβ-tubulin (red) is shown in the bottom panel. Colors correspond to subunits shown in D–I. (D) A Pseudo-atomic model of the TBC-DEG-Q73L:αβ-tubulin complex showing the interfaces of TBCD, TBCE, and Arl2 engaging the intact αβ-tubulin asymmetrically. The model is built by fitting the densities of TBC-DEG segments as described in Figure 4 in addition to αβ-tubulin structure into the dual lobed density. (E) A 90° vertically rotated view of that shown in D. (F) A 90° horizontally rotated view of that shown in D. Video 2 shows the C–F views. (G) A central slice view of 90° counterclockwise horizontally rotated view of that shown in D. (H) Cartoon view of TBC-DEG domain organization comparable to the view shown in F (I) Cartoon view of TBC-DEG domain organization comparable to the view shown in G.


