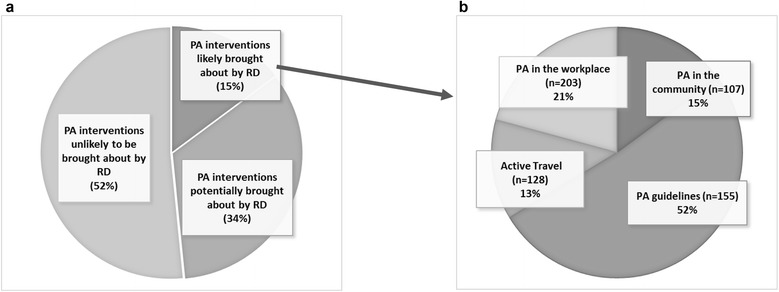
Fig. 3.

a. Overall proportion of interventions and whether they were likely encouraged by the RD, across the physical activity pledges. b. Out of 128 interventions judged to be encouraged by the RD (additionality code “1”), proportion across four physical activity pledgesa. aThe number in brackets indicates the number of organisations who signed up to each pledge. So for example, the active travel pledge (P3) had a total of 128 organisations at the time of data collection, and 13% of the interventions these organisations put in their delivery plans were judged to be motivated by the RD
