. 2015 Jun 23;4:e07090. doi: 10.7554/eLife.07090

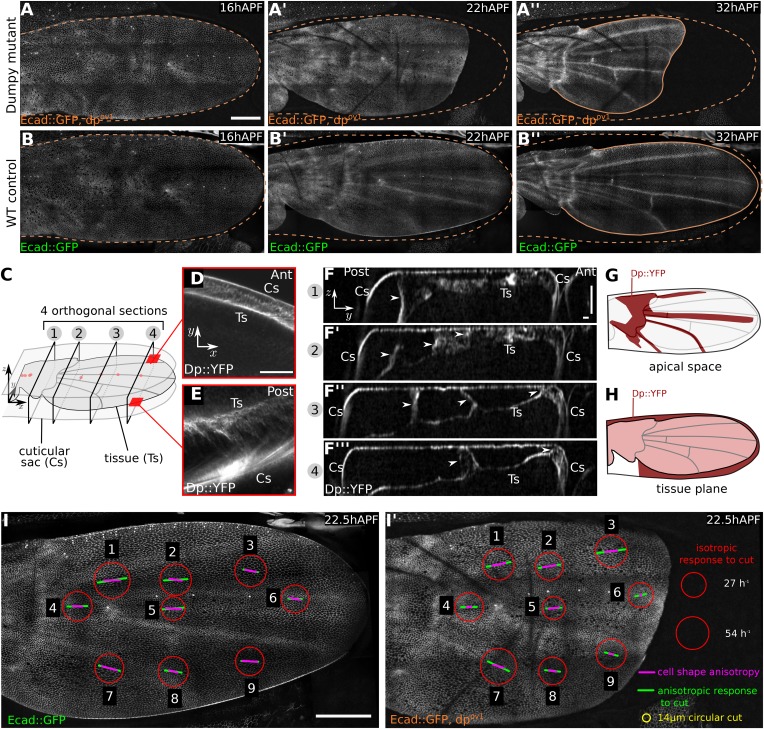
Figure 2. Dumpy-dependent apical attachments of wing tissue to the cuticle act as a counter-force to hinge contraction.

(AB′′) Show individual frames from a time-lapse video of dumpyov1 mutant and control WT wings expressing Ecad::GFP, and depict wings at 16 hAPF (A, B), 22 hAPF (A′, B′), and 32 hAPF (A′′, B′′). The position of the cuticle is indicated by a brown dashed line. Scale bar 100 µm. (C) Cartoon depicting the pupal wing and surrounding cuticular sac, labeled to indicate the optical sections shown in panels (DF). (DF′′′) Show optical sections through a 22 hAPF wing from a pupa harboring a Dumpy::YFP protein trap at the endogenous locus. (DE) Show sections in the plane of the wing epithelium near the anterior (D) and posterior (E) margins. Dumpy::YFP is present in the space between the wing margin and the cuticle. Scale bar 20 µm. (FF′′′) Show optical sections orthogonal to the wing epithelium at different proximal-distal positions (indicated in C). Dumpy::YFP connects the dorsal wing surface and the cuticle in specific positions (arrowheads). Scale bars: 20 µm. (G) Summarizes the pattern of Dumpy::YFP connections between the dorsal wing surface and overlying cuticle—these lie over the hinge and vein regions. (H) Shows the pattern of Dumpy::YFP connections between the wing margin and cuticle—these extend around the wing margin except in the posterior/proximal regions. (II′) Summarize quantifications of circular laser ablation experiments performed in nine specific regions of five WT and five dumpyov1 mutant wings. The size of the red circles indicates the initial rate of area expansion of the perimeter of the circular cut, which reflects the isotropic tissue stress. Green bars represent the direction and magnitude of the elliptical deformation of the initially circular cut, reflecting the anisotropy of tissue stress (see ‘Materials and methods’, Analysis of circular laser ablations). Magenta bars depict the orientation and magnitude of local cell elongation. Scale bar: 100 µm.

DOI: http://dx.doi.org/10.7554/eLife.07090.005

Figure 2.

Figure 2—figure supplement 1. Dumpy::YFP cuticle imprint and Dumpy apical connections.

Figure 2—figure supplement 1.

(A) Shows Dumpy::YFP fluorescence in the cuticle (>10 µm away from the apical wing surface) of a 22 hAPF wing (red square indicates enlarged region). Dumpy::YFP highlights imprints of cell boundaries in the cuticle. (B) Shows total Dumpy::YFP present between the dorsal wing surface and the cuticle. Dumpy::YFP signal was manually segmented and colored in green, then overlaid over a 22 hAPF WT Ecad::GFP expressing wing to highlight its position relative to wing veins (see also Video 3). Scale bar: 100 µm.
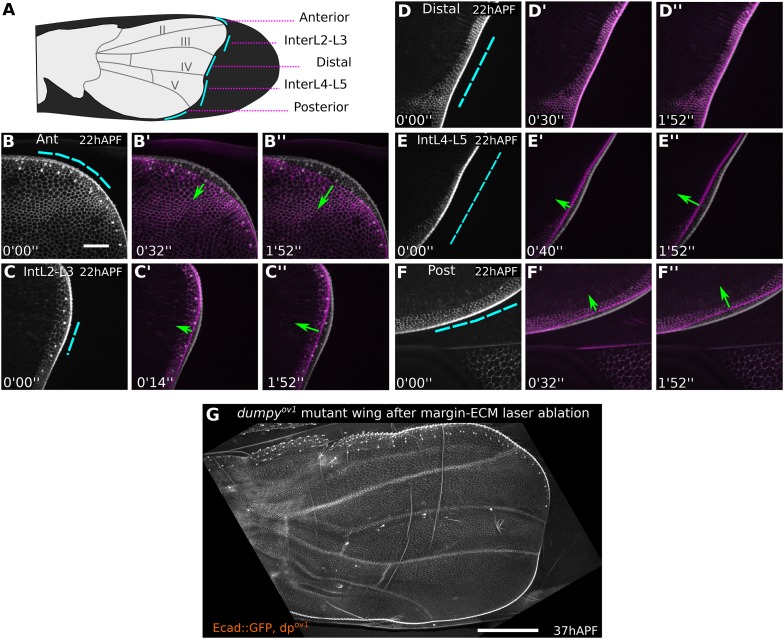
Figure 2—figure supplement 2. dumpyov1 weakens distal attachments between wing margin and cuticle.

Figure 2—figure supplement 2.

(A) Cartoon of a dumpyov1 mutant wing indicating sites of laser cuts (blue lines) performed in wings shown in (BF′′). (BF′′) Show 22 hAPF dumpyov1 mutant wings before (greyscale) and shortly after (magenta) laser severing in different regions between the margin and the cuticle. Blue dashed lines indicate cut site, and green arrows the amount and direction of retraction after the cut. Time after ablation is indicated (minutes, seconds). Tension-bearing connections are present anteriorly and posteriorly, but not distally in dumpyov1. Scale bar 20 µm. (G) dumpyov1 mutant wing at 37 hAPF, 15 hr after ablation of margin-cuticle connections in the whole region comprising panels BF′′. Scale bar 100 µm.
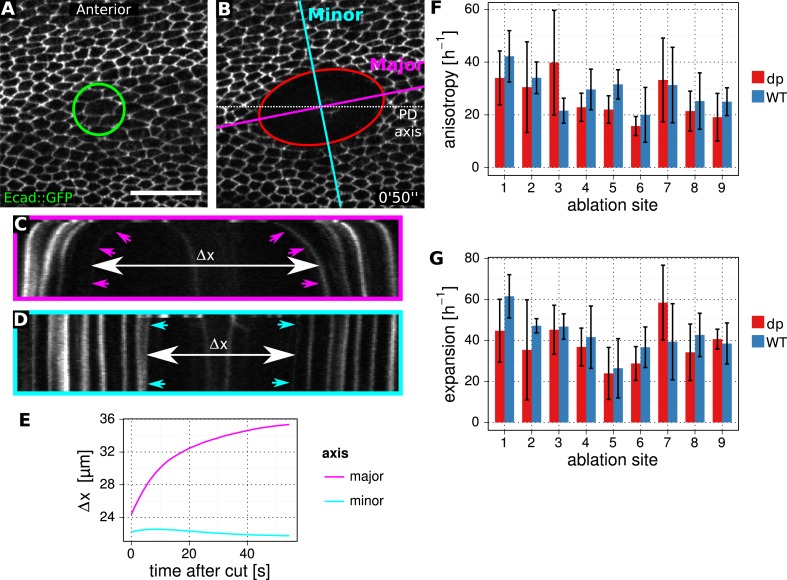
Figure 2—figure supplement 3. Method to determine stresses in WT and dumpyov1 mutant.

Figure 2—figure supplement 3.

(A, B) Enlarged regions of the wing epithelium at 22.5 hAPF, before (A) and 50 s after (B) circular laser ablation in the epithelium. The green circle depicts the 14 µm circular cut in diameter. The red ellipse is a fit to the manually segmented perimeter of the cut region at 50 s. Minor (blue) and major (magenta) axes of this ellipse are used to define orthogonal kymographs. Scale bar 20 µm. (C, D) Kymographs defined in (B). Arrowheads depict the lines that were segmented using Fiji. Δx shows the relative increase in wing tissue displacement along the major and minor axes after the cut. (E) Graph showing an example of the relative tissue displacement along the major and minor axes. These displacements are used to estimate the initial velocity gradient of recoil after laser ablation (‘Materials and methods’, Analysis of circular laser ablations). The initial velocity gradient reflects the isotropic and and anisotropic stresses in the tissue. (F, G) Comparison of stresses between WT control and dumpyov1 mutant wings. Circular cuts were performed in nine different locations as depicted in Figure 2I,I′. Error bars show standard deviation over five replicates for each location and genotype.