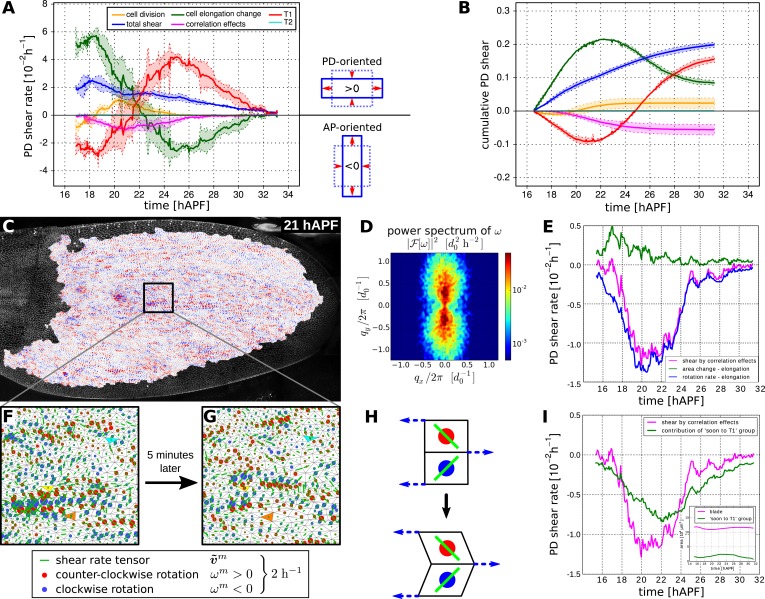
Figure 6. Total cellular contributions to tissue shear throughout the WT wing blade.
(A) Shows the tissue shear rate (blue) over time, and shear rates contributed by cell rearrangements (red), cell shape changes (green), cell divisions (orange), and correlation effects (magenta), averaged throughout the wing blade. These averages were taken over the tracked region shown in Figure 3A by averaging nematic tensors throughout the wing blade. The resulting quantities were further projected onto the PD axis and averaged over the three WT videos. Ribbons indicate the standard deviation between wings. The sign of the shear rate defines its orientation (>0 is PD-oriented and <0 is AP-oriented). (B) Shows the accumulated tissue shear over time throughout the blade, and the accumulated contributions of each cellular process (color code as in A). (C) Pattern of local tissue rotation rate at 21 hr after puparium formation (APF). The local tissue rotation rate ωm is plotted separately for each triangle m. Red circles correspond to a counter-clockwise rotation and blue circles correspond to a clockwise rotation. The area of each circle scales with the absolute rotation rate. (D) The spatial power spectrum of the local tissue rotation rate corresponding to the pattern in panel C (see Appendix 1, ‘Power spectrum of local tissue rotation’). The power spectrum is a function of a wave vector q = (qx, qy), which is measured in units of a typical cell diameter d0 = 4 μm. The two peaks in the power spectrum at qpeak ≈ (0, ±0.3d0/2π) correspond to the existence of horizontal bands of alternating tissue rotation that are separated by about 1.5 cell diameters (compare panels F, G). (E) Correlation effects contributing to shear along the PD axis, Dxx (magenta curve). Dxx can be decomposed into an area expansion part (green curve), which corresponds to a correlation between the local area expansion rate vm and local triangle elongation : , and into a rotational part (blue curve), which corresponds to a correlation between the local tissue rotation rate ωm and local triangle elongation: (see Appendix 1, ‘Large-scale shear in the absence of topological transitions’). The rotational part dominates the shear by correlation effects. (F) Enlargement of the rotation pattern in panel C with an additional indication of the pattern of the local shear rate tensor by green bars. Length and orientation of a bar correspond to magnitude and axis of the local shear rate, respectively. The axis of local shear is correlated with the sign of local rotation (indicated by red and blue circles). (G) The same region of the wing in the subsequent frame (about 5 min later). Three corresponding triangles in panels F and G are colored in cyan, yellow and orange, respectively. The patterns of local shear and rotation change on time scales of minutes. (H) A correlation of local rotation and local shear within bands as shown in panels F, G corresponds to bands of alternating simple shear. (I) Contribution to the shear due to correlation effects of the group of triangles that are going to disappear due to a T1 transition within nine video frames (<45 min) (Appendix 1, ‘Role of T1 transitions in the correlation-induced shear’). Inset: the area of this group is small compared to the total blade area, although it accounts for a significant amount of shear due to correlation effects in the blade.


