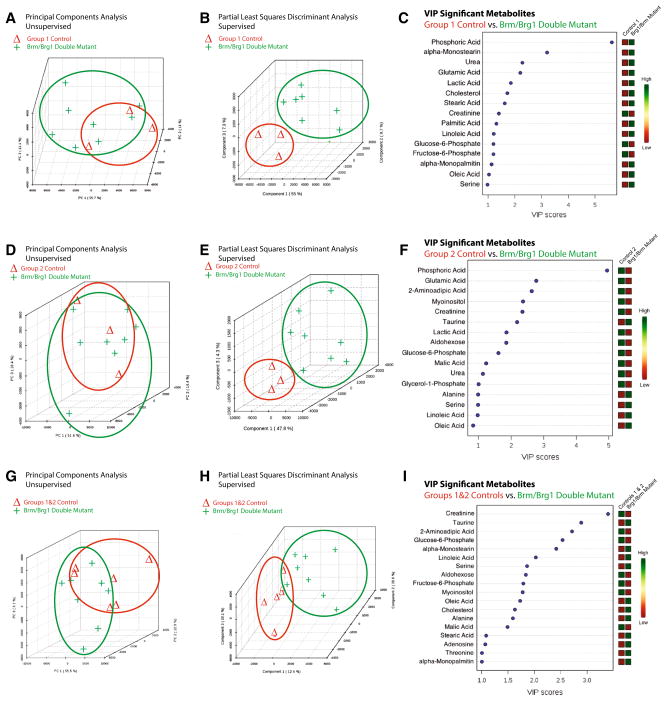
Fig. 2.
The metabolomic profiles of Brg1/Brm double-mutant hearts are significantly different from control hearts prepared and analyzed in parallel. Principal components analysis (PCA) illustrating the unsupervised relationship between Brg1/Brm double-mutant hearts (Brg1floxed/floxed; αMHC-Cre-ERT+/0; Brm−/− mice plus tamoxifen treatment) compared to a Control Group 1 (Brg1floxed/floxed; αMHC-Cre-ERT+/0; Brm−/− minus tamoxifen treatment) d Control Group 2 (Brg1floxed/floxed; αMHC-Cre-ERT0/0(no transgene); Brm−/− mice plus tamoxifen treatment), and g Combined Control Groups 1 & 2 hearts. Partial least squares discriminant analysis (PLS-DA) score visualizes supervised (assigned group) clustering of Brg1/Brm double-mutant heart metabolomics compared to b Control Group 1 e Control Group 2, and h Control Groups 1 & 2. Data points that are closer together indicate higher degree of similarity than data points that are further apart. PLS-DA score plots for Brg1/Brm double-mutant heart metabolites (red) compared to metabolites identified in control hearts (green). Each point represents the combined metabolite profile in an individual mouse. Variable importance in projection (VIP) plot of VIP statistical analysis identifying the top 15 metabolites contributing to the differences between the Brg1/Brm double mutant and c Control Group 1 f Control Group 2, and i Control Groups 1 & 2 hearts (relative concentration to the right of the figure). N = 8 (Brg1/Brm double-mutant hearts), N = 3 (Control Group 1), N = 3 (Control Group 2), N = 6 (Control Groups 1 & 2) hearts per group analyzed. Each point represents an individual mouse heart run in parallel with the other samples (Color figure online)

