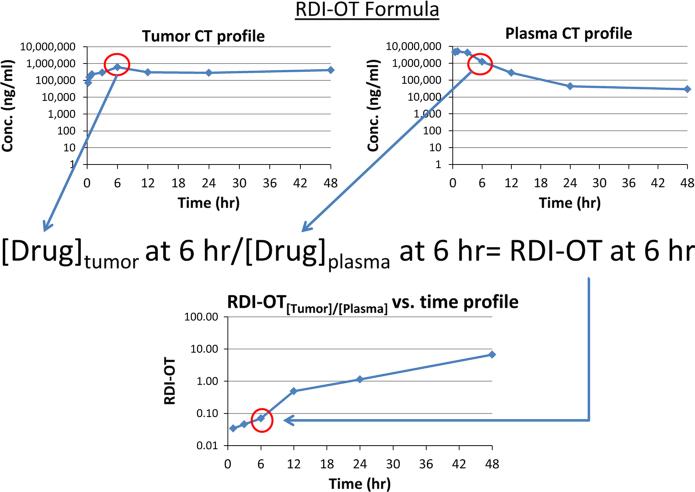
Fig. 1.
Illustration of a theoretical relative distribution index-over time (RDI-OT) calculation. Plot on the top left is a theoretical tumor drug concentration versus time profile. Plot on the top right is a theoretical plasma drug concentration versus time profile. The 6 h RDI-OT value is calculated by dividing the 6 h tumor drug concentration by the 6 h plasma drug concentration. The RDI-OT is calculated for each time point. RDI-OT values can then be plotted against time (plot on the bottom left) and the AUC of the RDI-OT curve can be calculated as a measure of efficiency of drug delivery

