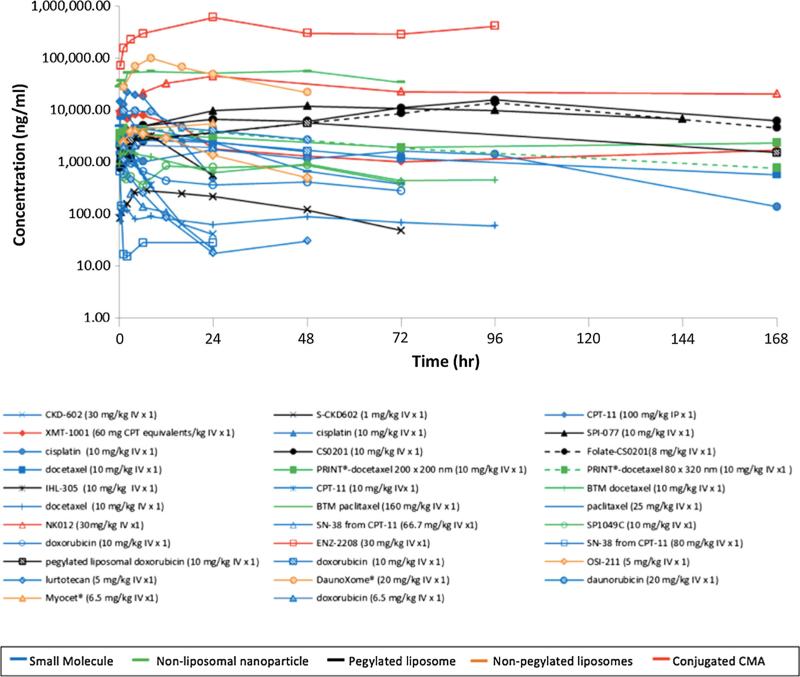
Fig. 3.
Comparison of concentration versus time profiles in tumor following the administration of CMAs and SMs. The tumor concentration versus time curves for all agents identified in the study. Curves with corresponding symbols indicate that those agents are from the same study. Blue curves represent SMs, green curves represent non-liposomal nanoparticles, black curves represent PEGylated lipsomes, orange curves represent non-PEGylated liposomes, and red curves represent conjugated agents. (Color figure online)

