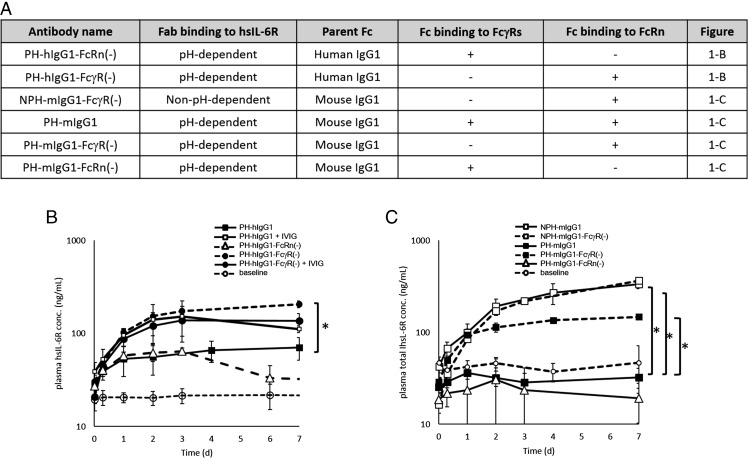
FIGURE 1.
FcγR but not FcRn contributes to the Ag clearance of a pH-dependent binding Ab. (A) Ab variants used in (B) and (C) are described. (B and C) Effect of Abs on the total hsIL-6R plasma concentration was evaluated in a steady-state model using hFcRn Tg mice or wild-type mice. Steady-state plasma concentration of ∼20 ng/ml hsIL-6R was maintained using an infusion pump filled with hsIL-6R solution. The time profiles of total hsIL-6R plasma concentration are shown. (B) PH-hIgG1 (▪), PH-hIgG1-FcRn(−) (△), and PH-hIgG1-FcγR(−) (● with dashed line) were i.v. administered to hFcRn Tg mice as single doses of 1 mg/kg, and PH-hIgG1 (□) and PH-hIgG1-FcγR(−) (▪ with solid line) were i.v. administered to hFcRn Tg mice as single doses of 1 mg/kg together with 1 g/kg IVIG. Plasma hsIL-6R concentration without Ab was set as baseline (○). An asterisk indicates a statistically different level of hsIL-6R between PH-hIgG1 and PH-hIgG1-FcγR(−) on day 7. (C) NPH-mIgG1 (□ with solid line), NPH-mIgG1-FcγR(−) (□ with dashed line), PH-mIgG1 (▪ with solid line), PH-mIgG1-FcγR(−) (▪ with solid line), and PH-mIgG1-FcRn(−) (△ with solid line) were i.v. administered as single doses of 1 mg/kg. An asterisk indicates statistically different levels of hsIL-6R between PH-mIgG1 and NPH-mIgG1, NPH-mIgG1-FcγR(−), or PH-mIgG1-FcγR(−) on day 7. Each datum point represents the mean ± SD (n = 3 each). Statistical significance was determined by a Dunnett test. *p < 0.05.

