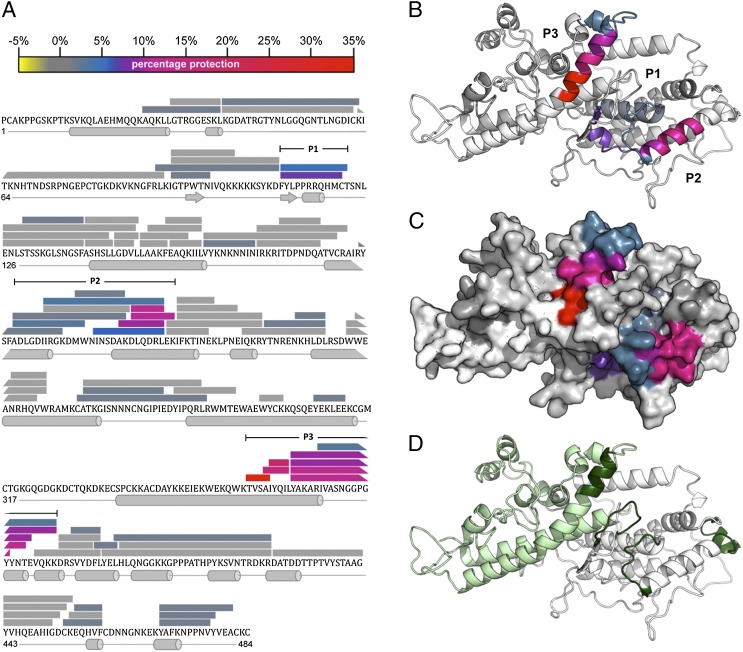
FIGURE 6.
The 24E9 Fab binds to the convex surface of PFD1235w DBLβ3_D4. (A) Peptides from DBLβ3_D4 that were identified in mass spectra are represented by bars overlaying the primary sequence. The secondary structure, derived from a homology model of DBLβ3_D4, is shown below the sequence. The level of protection of individual peptides, as determined by comparing the %D incorporation over 200 min for free DBLβ3_D4 with that for DBLβ3_D4 bound to 24E9 Fab, is color coded according to the scale bar. Highly protected areas are in red, whereas unprotected areas are in gray. Three highly protected regions were P1 (residues 110–121), P2 (193–220), and P3 (357–388), as indicated. (B) HDX MX results were mapped onto a model of the PFD1235w DBLβ3_D4 domain. Protected areas are color coded as shown in (A). (C) Surface of PFD1235w DBLβ3_D4 model as shown in (B). (D) Potential ICAM-1 binding sites on the DBLβ3_D4 model as predicted by Bertonati and Tramontano (18) (green) and determined by Bengtsson et al. (12) (light green).

