
Fig. 2.
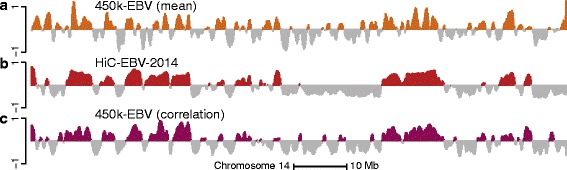
The methylation correlation signal is a better predictor of A/B compartments than the average methylation signal. The figure displays data on all of chromosome 14 at 100-kb resolution. a The smoothed, average methylation signal on the beta-value scale for the 450 k-EBV dataset. The signal has been centered by the mean and the sign has been reversed so that values close to one correspond to low methylation values. b The first eigenvector of the HiC-EBV-2014 Hi-C dataset. c The smoothed first eigenvector of the binned correlation matrix of the 450 k-EBV dataset. We see that (c) correlates better with (b) than (a)