Fig. 3.

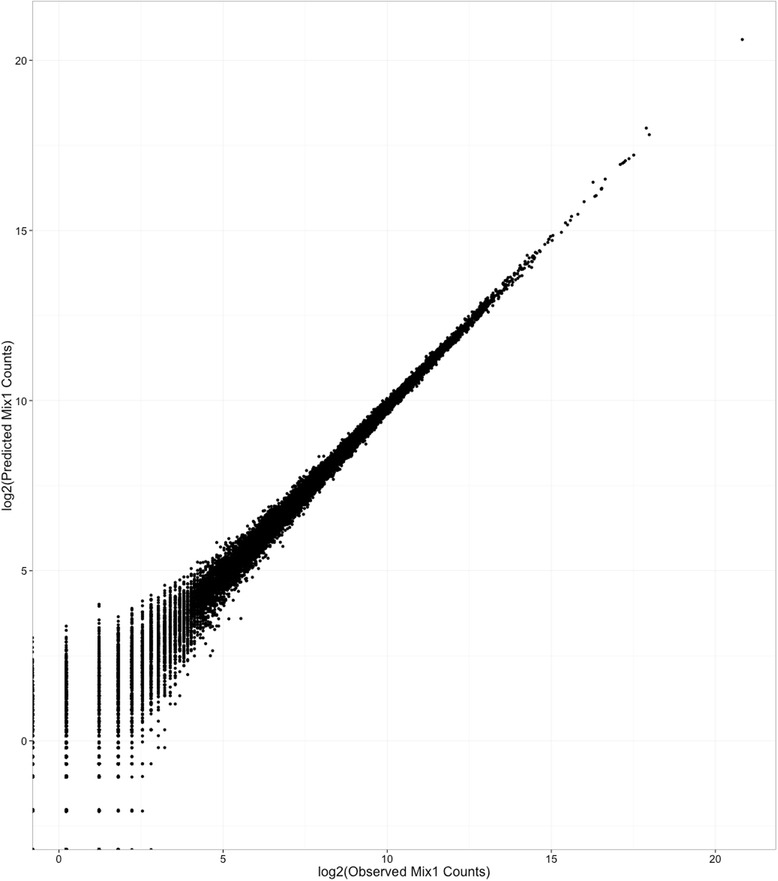
Comparison of observed and predicted counts. Observed BLM mix 1 counts (x) are plotted against predicted BLM mix 1 counts (y). Predicted counts are calculated using eq. 2. Counts are on the log2 scale

Comparison of observed and predicted counts. Observed BLM mix 1 counts (x) are plotted against predicted BLM mix 1 counts (y). Predicted counts are calculated using eq. 2. Counts are on the log2 scale