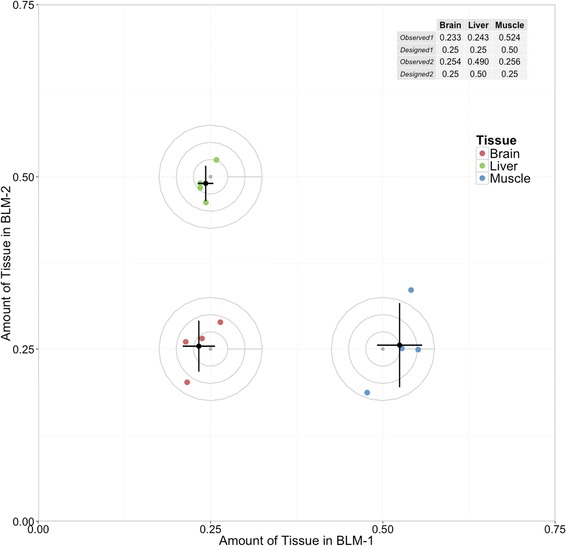
Fig. 4.

Accuracy of model-derived BLM mix estimates. The grey center point is the nominal ‘truth’ ratio in which the samples were mixed. Concentric circles with radius at multiples of 0.025 are added to visually clarify distance from the center point. Colored points depict mixture proportion (Φ) estimates generated from measurements of 4 replicate libraries. Black points are the mean of the replicates. Error bars show one standard deviation of the four replicate measures
