
Fig. 3.
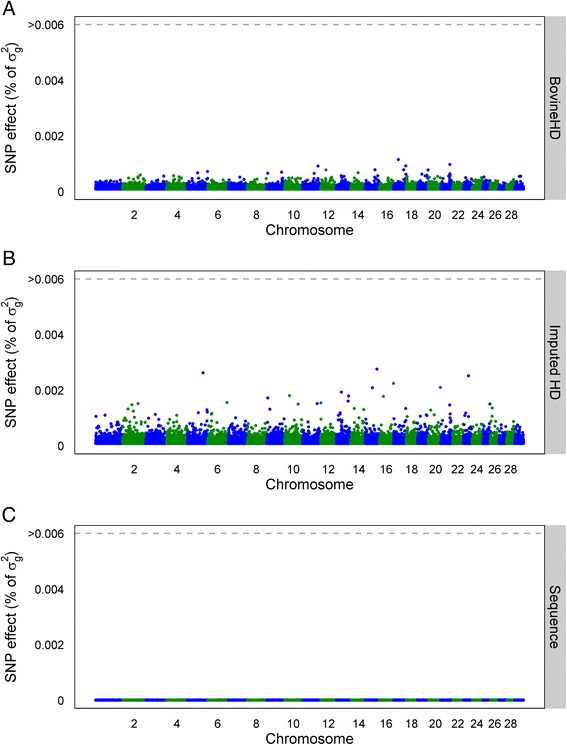
Manhattan plot with estimated SNP effects (% of σ 2g) for interval between first and last lactation (IFL) using the BSSVS model. Estimated SNP effects (% of σ 2g) based on the BSSVS model for interval between first and last lactation using BovineHD data (a), ImputedHD data (b), and imputed sequence data (c)