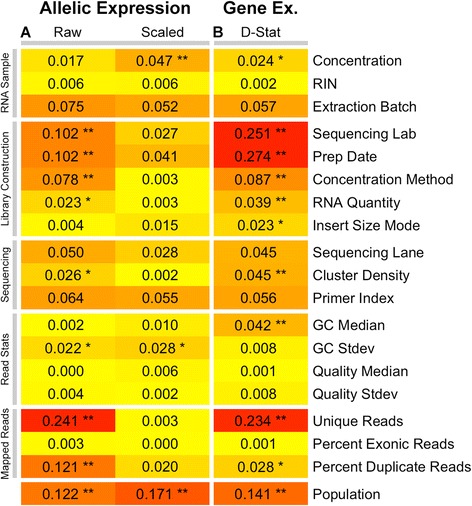
Fig. 5.

Technical covariates of AE. a Correlation of AE with technical covariates, measured as correlation (R2) between each covariate and the percentage of significant AE sites in a sample (binomial p < 0.05, het-SNPs with ≥30 reads), both before and after scaling to 30 reads. b Correlation of gene expression with technical covariates. As the gene expression statistic we use the median correlation of each sample to all other samples (D-statistic). Correlation to a biological covariate (population) is shown for comparison. Correlations were calculated from all Geuvadis samples by Spearman correlation for continuous covariates, or linear regression for categorical covariates. **p < 0.01, *p < 0.05, after Bonferroni correction. RIN RNA integrity number, Stdev standard deviation
