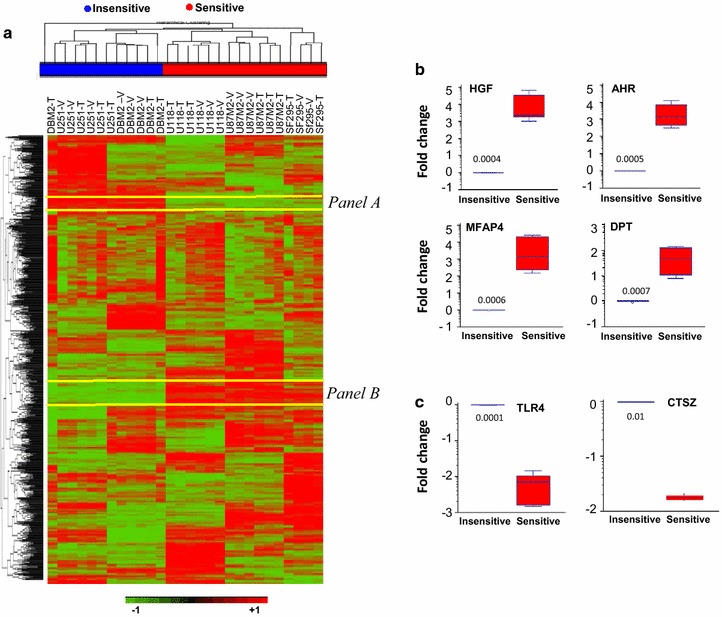
Fig. 3.

An HGF signature separates sensitive and insensitive models. a Using the TCGA data sets and approach [14], the transcriptional profiles of patients having high or low HGF expression were compared, and 887 genes were identified as differentially expressed (Student’s t test, p ≤ 0.0001). After clustering these genes with the glioma cell line xenograft data sets, we found 56 genes that were uniquely down- (Panel A) or up-regulated (Panel B) in the sensitive tumors. Among them there are 21 genes overlapping with those found in Fig. 2C, providing a signature of an HGF network (Table 1) that may identify tumors sensitive to MET inhibitors. b–c From the 21 gene signature, selected genes that are up-regulated (b) or down-regulated (c) were validated using qPCR. mRNAs from U87M2 and U118 were used for sensitive tumors, and mRNAs from U251M2 and DBM2 were used for insensitive tumors. Fold change = log (signal intensity from sensitive tumors/signal intensity from insensitive tumors)
