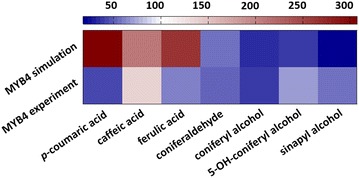
Fig. 7.

Steady-state profiles of key pathway metabolites in PvMYB4 overexpression as predicted by the model. Concentrations are normalized and the base value is set to 100, which corresponds to white in the color bar. Any increases with respect to the wild-type steady state are reflected in the red spectrum and any decreases in the blue spectrum
