
Fig. 1.
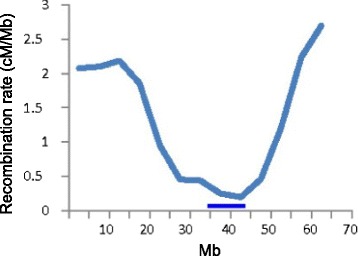
Recombination rates along chromosome Jr1. The horizontal axis is the physical map in Mb of Jr1 and the vertical axis is recombination rate in cM/Mb. The horizontal bar marks the location of a gap in synteny between the Jr1 physical map and the grape, poplar, apple, cucumber, Medicago truncatula, and strawberry pseudomolecules. We suggest that the collocation of the recombination rate global minimum and the synteny gap marks the Jr1 centromeric region