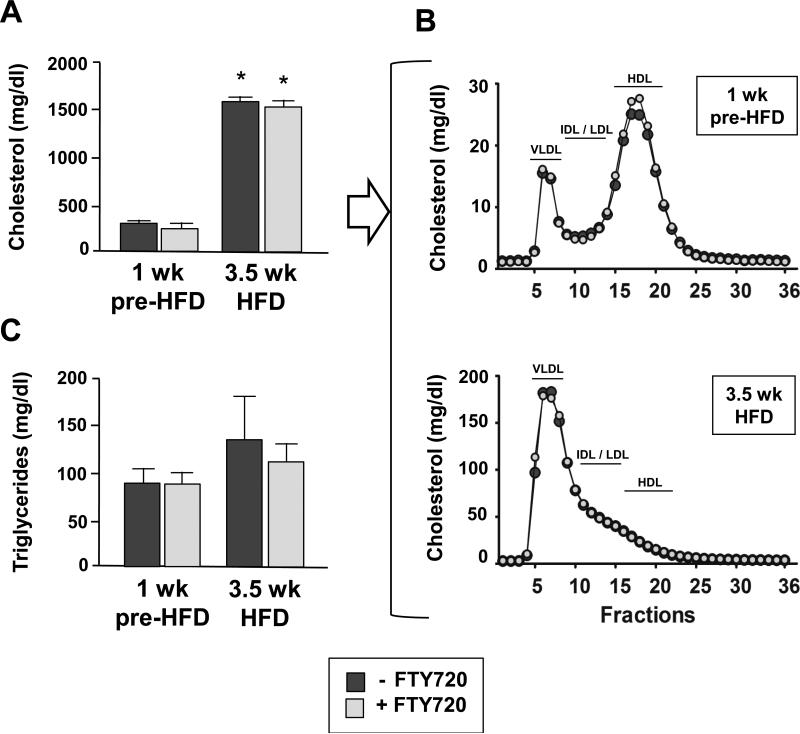
Figure 4.
(A and B) Plasma cholesterol levels (n=16-20 ApoeR61h/h/SRB1–/– mice/group) and lipoprotein profiles (n=3 pools with 3-7 mice/pool). Data are at 1wk pre-HFD and at 3.5wk after starting the HFD. Mice were fed FTY720 or not. As can be seen, the lipoprotein profiles are identical. Lipoprotein classes are indicated as VLDL (very low density lipoprotein), IDL/LDL (intermediate density lipoprotein / low density lipoprotein) and HDL (high density lipoprotein) (C) Plasma triglyceride levels obtained in the same mice also show no difference. Data are mean ± SEM. * P<0.001 (1wk pre-HFD vs 3.5wk HFD for both control and FTY720). 1wk pre-HFD = 1week ± FTY720-treatment on chow diet; 3.5wk HFD = 3.5 weeks ± FTY720-treatment with HFD feeding. HFD = high fat high cholesterol diet.

