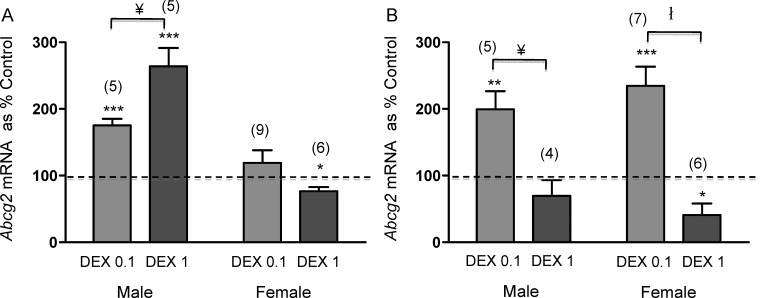
FIG. 2.
Abcg2 mRNA on E15.5 (A) and E18.5 (B) from male and female brains following DEX treatment (0.1 and 1 mg/kg). The error bar represents the mean ± SEM expressed as relative units of mRNA standardized against Gapdh. Treatment data were then normalized to respective vehicle and presented as percentage vehicle. The dotted line represents the control. The number in parentheses represents the number of dams per treatment group. *P < 0.05, **P < 0.01, ***P < 0.001 versus control, two-way ANOVA, followed by post hoc analysis comparing dose. ¥P < 0.05, łP < 0.001.

