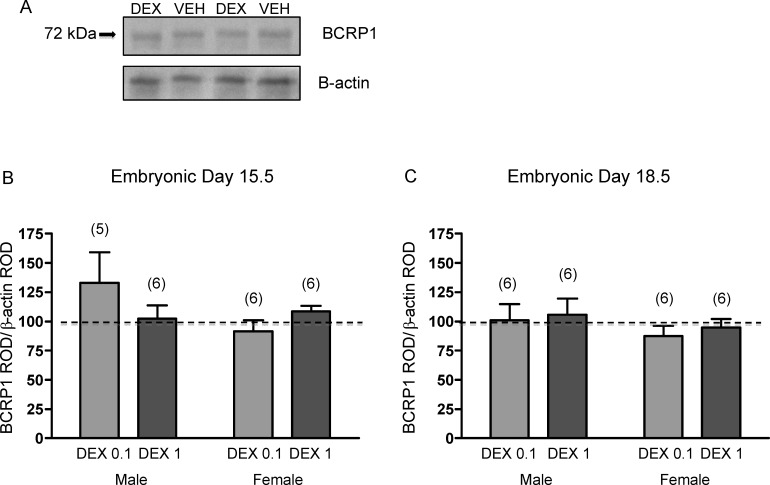
FIG. 3.
A) Representative immunoblot of fetal brain BCRP1 protein following treatment with DEX (0.1 mg/kg) or vehicle (VEH). BCRP1 protein on E15.5 (B) and E18.5 (C) from male and female brains following DEX treatment (0.1 mg/kg [DEX 0.1] or 1 mg/kg [DEX 1]). The error bar represents the mean ± SEM expressed as relative optical density (ROD) of BCRP1 standardized against β-actin ROD. Treatment data were then normalized to respective vehicle. The dotted line represents the control. The number in parentheses represents the number of dams per treatment group.

