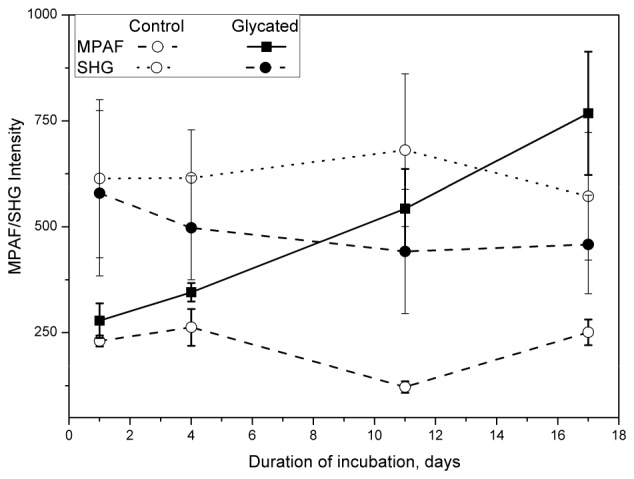
Fig. 5.

MPAF (solid lines) and SHG (dashed lines) signal intensity obtained from porcine skin as a function of days of skin incubation in 0.165 M ribose (glycated) or PBS (control). Each data point represents the average intensity recorded from 4 multiphoton microscopy images obtained over 150 µm of skin depth.
