
Fig. 3.
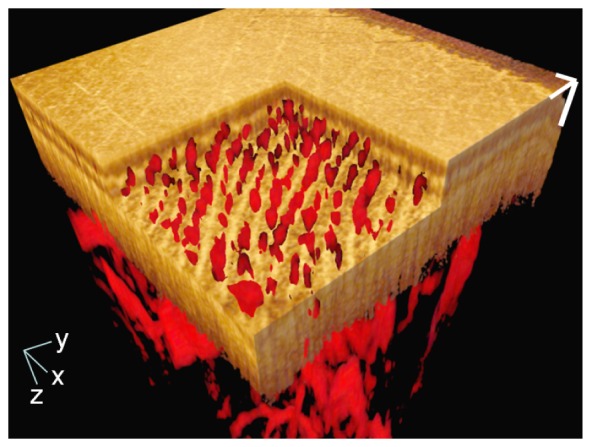
Single frame from the 3D-rendered video of the fused PAT/OCT data from a healthy subject (video available at Visualization 2 (11.1MB, MOV) ). The OCT data is presented with the gold colormap and the PAT data with the red colormap. The virtual cutout shows the capillary loop system in the papillary dermis. The PAT data is the same as in Fig. 2. The x- and y-axis scale bars: 1 mm; z-axis scale bar: 200 µm.