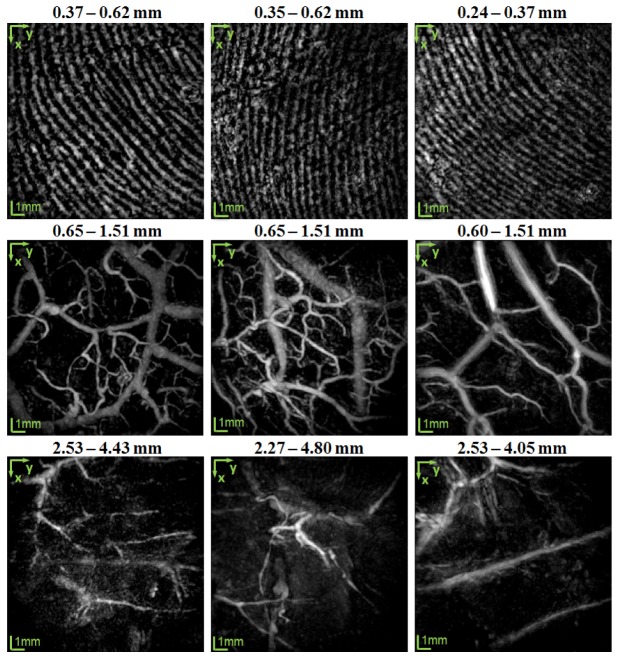
Fig. 4.
MIP PAT images of three healthy subjects (columns). The rows from top to bottom represent the vascular distribution in the dermal papillae, mid- and deep dermis, and subcutaneous fat layer, respectively. Images in each column are of one subject. The vessels in the dermal papillae are organized into the capillary loop system and are visualized as parallel curves. In the middle row, the vessels are grouped according to size, with the smaller vessels having an average diameter of 200 µm and the larger vessels having an average diameter of 890 µm. The smaller vessels are mainly the interconnecting vessels. The average diameter of the subcutaneous vessels is 340 µm.

