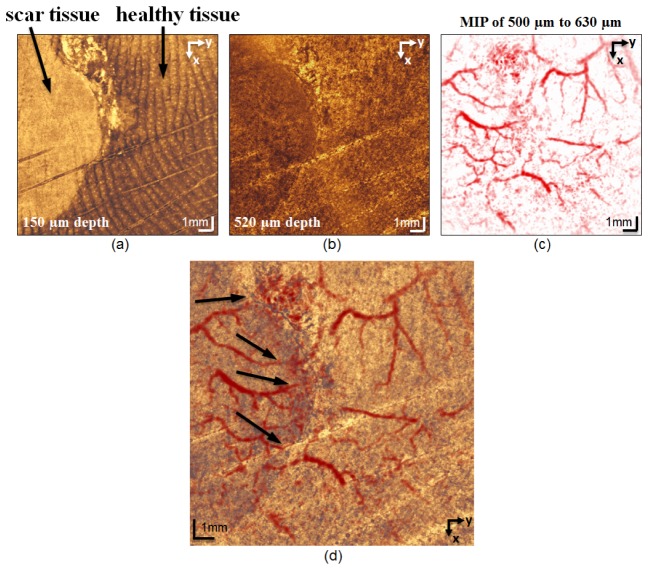
Fig. 9.
Images from a patient with dyshidrotic hand eczema. (a) En face OCT images at a depth of 150 µm. The texture of the scar tissue on the left side of the image is distinctly different from the healthy tissue on the right. Ridges of the papillary dermis and the sweat ducts (bright spots) are visible. (b) En face OCT images at a depth of 520 μm. The border between the scar tissue and the healthy tissue is noticeable at this depth. (c) MIP PAT integrating the depth range 500−630 μm. (d) PAT images overlaid on OCT images. Notice the thinning of the vessels at the interface between the scar tissue and the heathy tissue (black arrows). The 3D-rendered video of the fused PAT/OCT data is available at Visualization 5 (10.5MB, MOV) .

