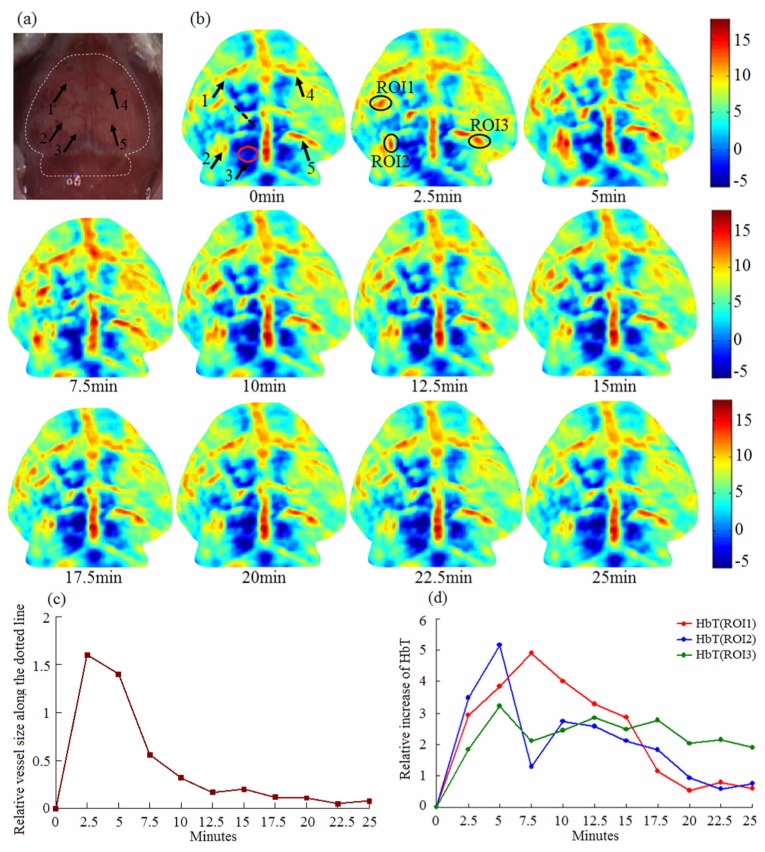
Fig. 4.
PAT imaging of cerebral hypoperfusion during acupuncture.; (a) Photograph of mouse brain with scalp stripped; five blood vessels are indicated by arrows . (b) PAT images at different time points (0-25 min after acupuncture). Five arrows in the first image are corresponding to that in the photograph. Three ROIs are marked in the second PAT image for the calculation of HbT concentration; (c) The relative variation of vessel size along the black dotted line in the first image in (b) ;(d) Quantitative plots of HbT concentration over time in three ROIs.

