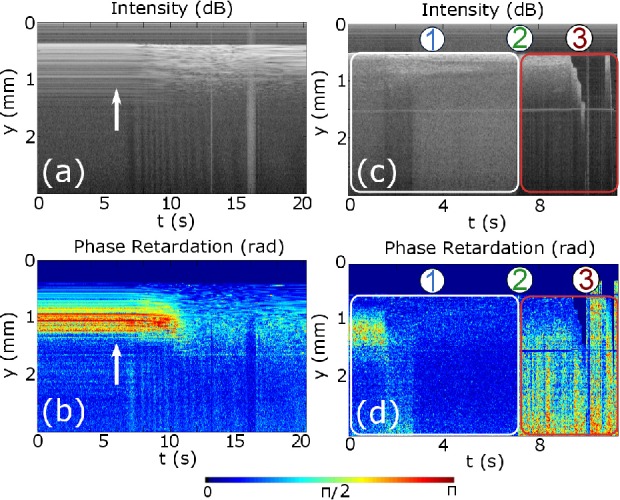
Fig. 5.

Representative OCR images of an in-vitro swine myocardium with the forward imaging catheter probe: (a) and (b) show the structural and accumulated phase retardation evolution in time (M-scan), respectively. The measurement was done applying 40W and the arrow represents the time instant when the RF power start to be applied. (c) and (d) show the recorded structural and polarization sensitive signal for RFA treatment when the tip moves, respectively. Region 1 represents the RFA time interval, in 2 slippage appears and in 3 the contact is lost.
