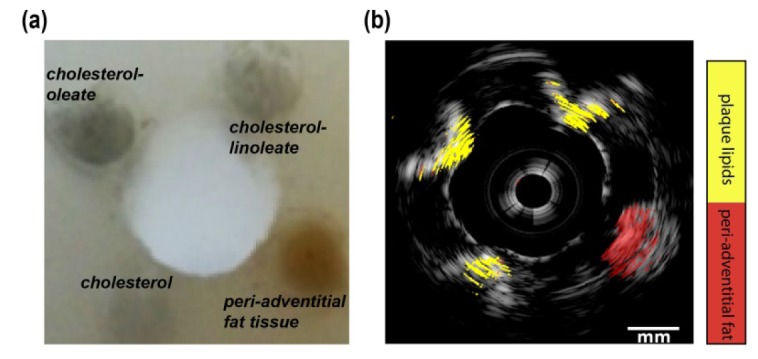
Fig. 5.

Lipid detection and differentiation result of the PVA vessel mimicking phantom. (a) The photo of the PVA vessel phantom with filled different lipid samples. (b) Lipid differentiation map fused with US image of the PVA vessel phantom. The lipids in plaques are in yellow and lipids in peri-adventitial tissue are in red. The dynamic range of the US image is 40 dB.
