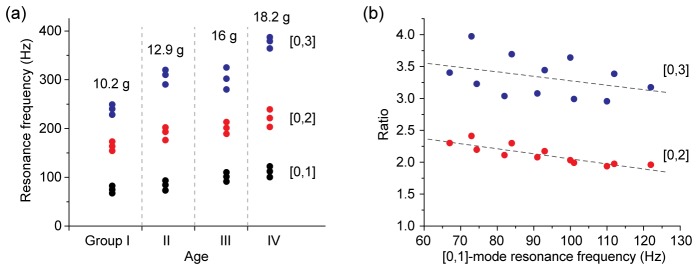
Fig. 4.

Resonance frequencies of 12 bovine eyeballs ex vivo. (a) Frequency response curves of four sample groups divided by their weights and ages (unspecified). Each group consists of three eyeballs with similar weights (the mean value is given). For each eyeball, the resonance frequencies of three modes—[0,1], [0,2] and [0,3]—are plotted. (b) The ratio of the resonance frequencies of the [0,2] or [0,3] mode to the fundamental [0,1] mode. Dotted lines, linear fit.
