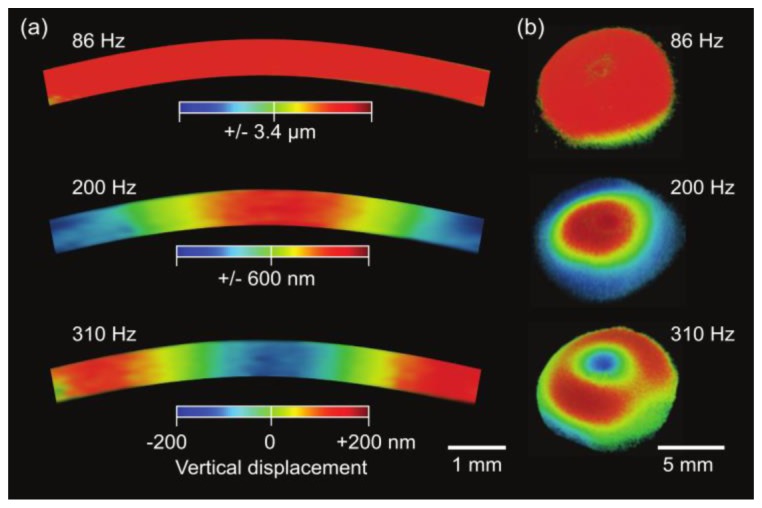
Fig. 5.

Experimentally measured vibration modes of the bovine cornea. The timing of the snapshot images corresponds to a zero phase when the potential energy of vibration is the maximum. (a) Cross-sectional OCT vibrography images for sound frequencies at 86 Hz, 200 Hz, and 310 Hz. (b) 3-D rendered vibrography images. Color scale represents anterior-posterior (vertical, upward normal to the corneal surface) displacement.
