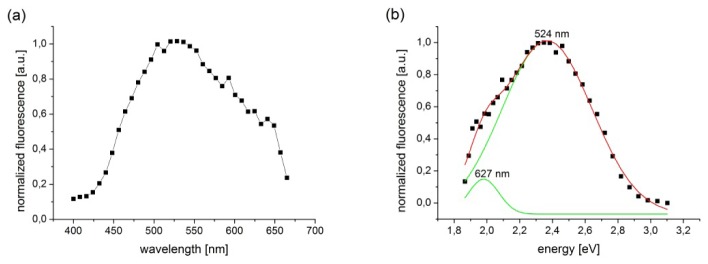
Fig. 5.

Fluorescence emission spectrum from the RPE of a live Rpe65−/−mouse. (a) Spectrum measured with a periscope had maximum at 524 nm. (b) Deconvolution of the spectrum (black squares, red line) revealed two components (green lines), one with a maximum at 524 nm and the second, a long wavelength shoulder with a maximum at 627 nm.
