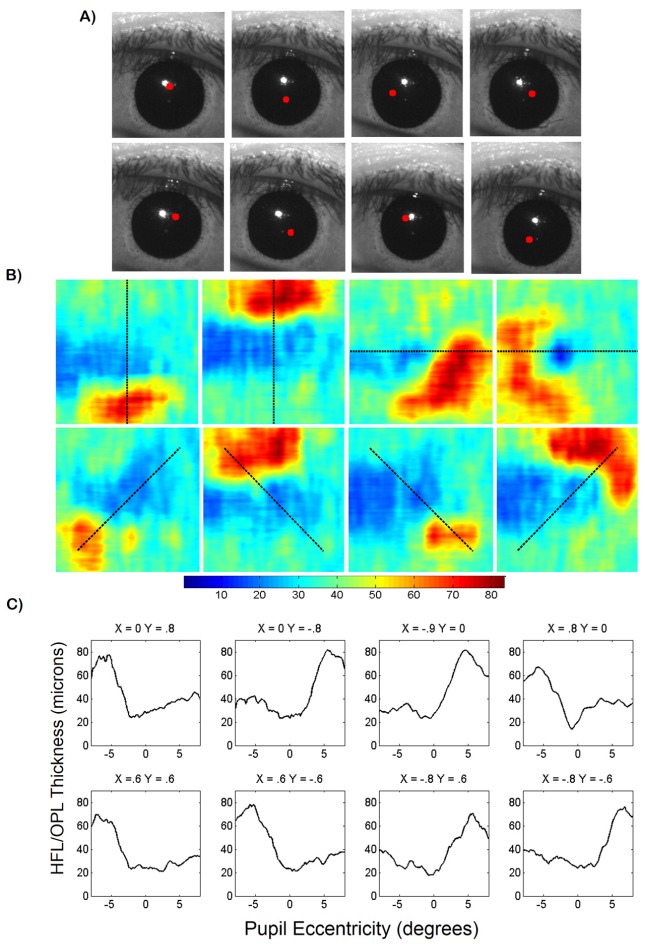
Fig. 10.
(A) corresponding pupil camera frames with beam entry position denoted by red dot. (B) HFL + OPL complex thickness maps generated using semi-automatic segmentation of OCT volumes acquired at 8 pupil entry positions. Color bar is in microns. Dashed black lines denote thickness map profile shown below. (C) HFL + OPL thickness plots acquired from thickness maps in (B). Pupil entry positions above thickness plots are in millimeters and referenced to the pupil centroid calculated in real time.

