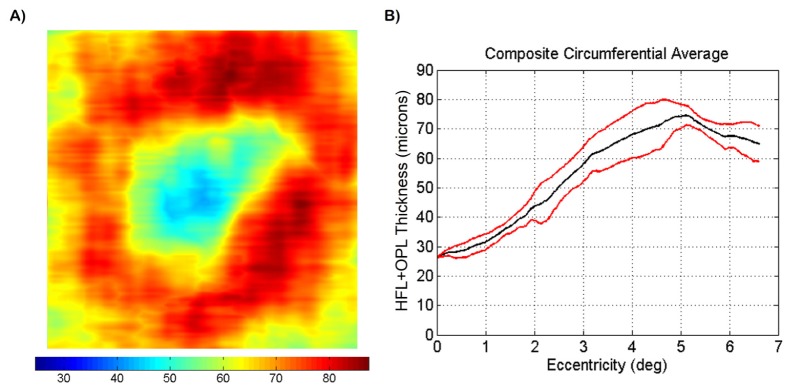
Fig. 11.

(A) HFL + OPL composite thickness map. The thickness maps shown in Fig. 10 were registered based on foveal position and the largest thickness values were extracted to generate the composite map. Color bar is in microns. (B) circumferential average HFL + OPL thickness as a function of retinal eccentricity. 360 radially oriented profiles, spaced 1° apart, were calculated. Mean (black) and standard deviation (red) were calculated and plotted.
