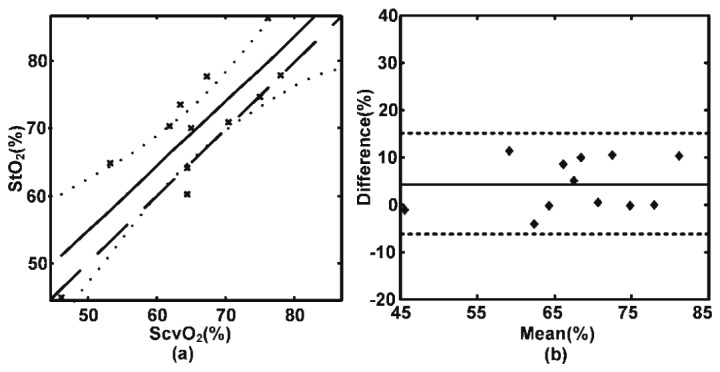
Fig. 4.

NIRS-measured StO2 compared to the gold standard ScvO2 from the blood sample test. (a) The solid line represents the best fit to the data; the dashed line indicates the perfect equivalent; and the dot line denotes the 95% confidence interval for StO2. (b) Bland-Altman plot of the deference between the StO2 and ScvO2 as well as the mean difference (solid horizontal line) between these two parameters. The dash lines indicate the 95% limits of an agreement.
